Post
Spatial Patterns of Infant Poverty in Mexico: A Case Study of Tijuana
Introduction
Mexico’s inequality is not only social or economic. It is also spatial. In many cities, different forms of vulnerability are clearly concentrated in different parts of the urban fabric.
I wanted to look at that pattern in Tijuana through the lens of children and family conditions. Tijuana is a useful case because it is large, unequal, fast-changing, and shaped by migration, border dynamics, and uneven urban development.
This is not a full poverty model. It is a spatial exercise using census-based indicators to see where child-related vulnerability seems to cluster.
Key Findings
Using census data from INEGI, I analyzed 24,561 neighborhoods across Tijuana, representing 1.94 million residents including 443,894 children aged 0-14.
A few results stand out:
- Dramatic Spatial Variation: Child population density varies from 0% to nearly 71% across neighborhoods, with a city-wide average of 20.9%
- Four Distinct Vulnerability Clusters:
- Low Vulnerability (42.7% of areas): Higher child populations (27%) but better services
- Moderate Vulnerability (31.2% of areas): Average child populations but high lack of social security (40%)
- High Vulnerability (15.3% of areas): Lower child populations but concentrated disadvantage
- Extreme Vulnerability (10.8% of areas): High educational gaps (9.6% without secondary education)
- Strong Housing-Demographics Correlation: Areas with more children show significantly lower housing quality (correlation: 0.435)
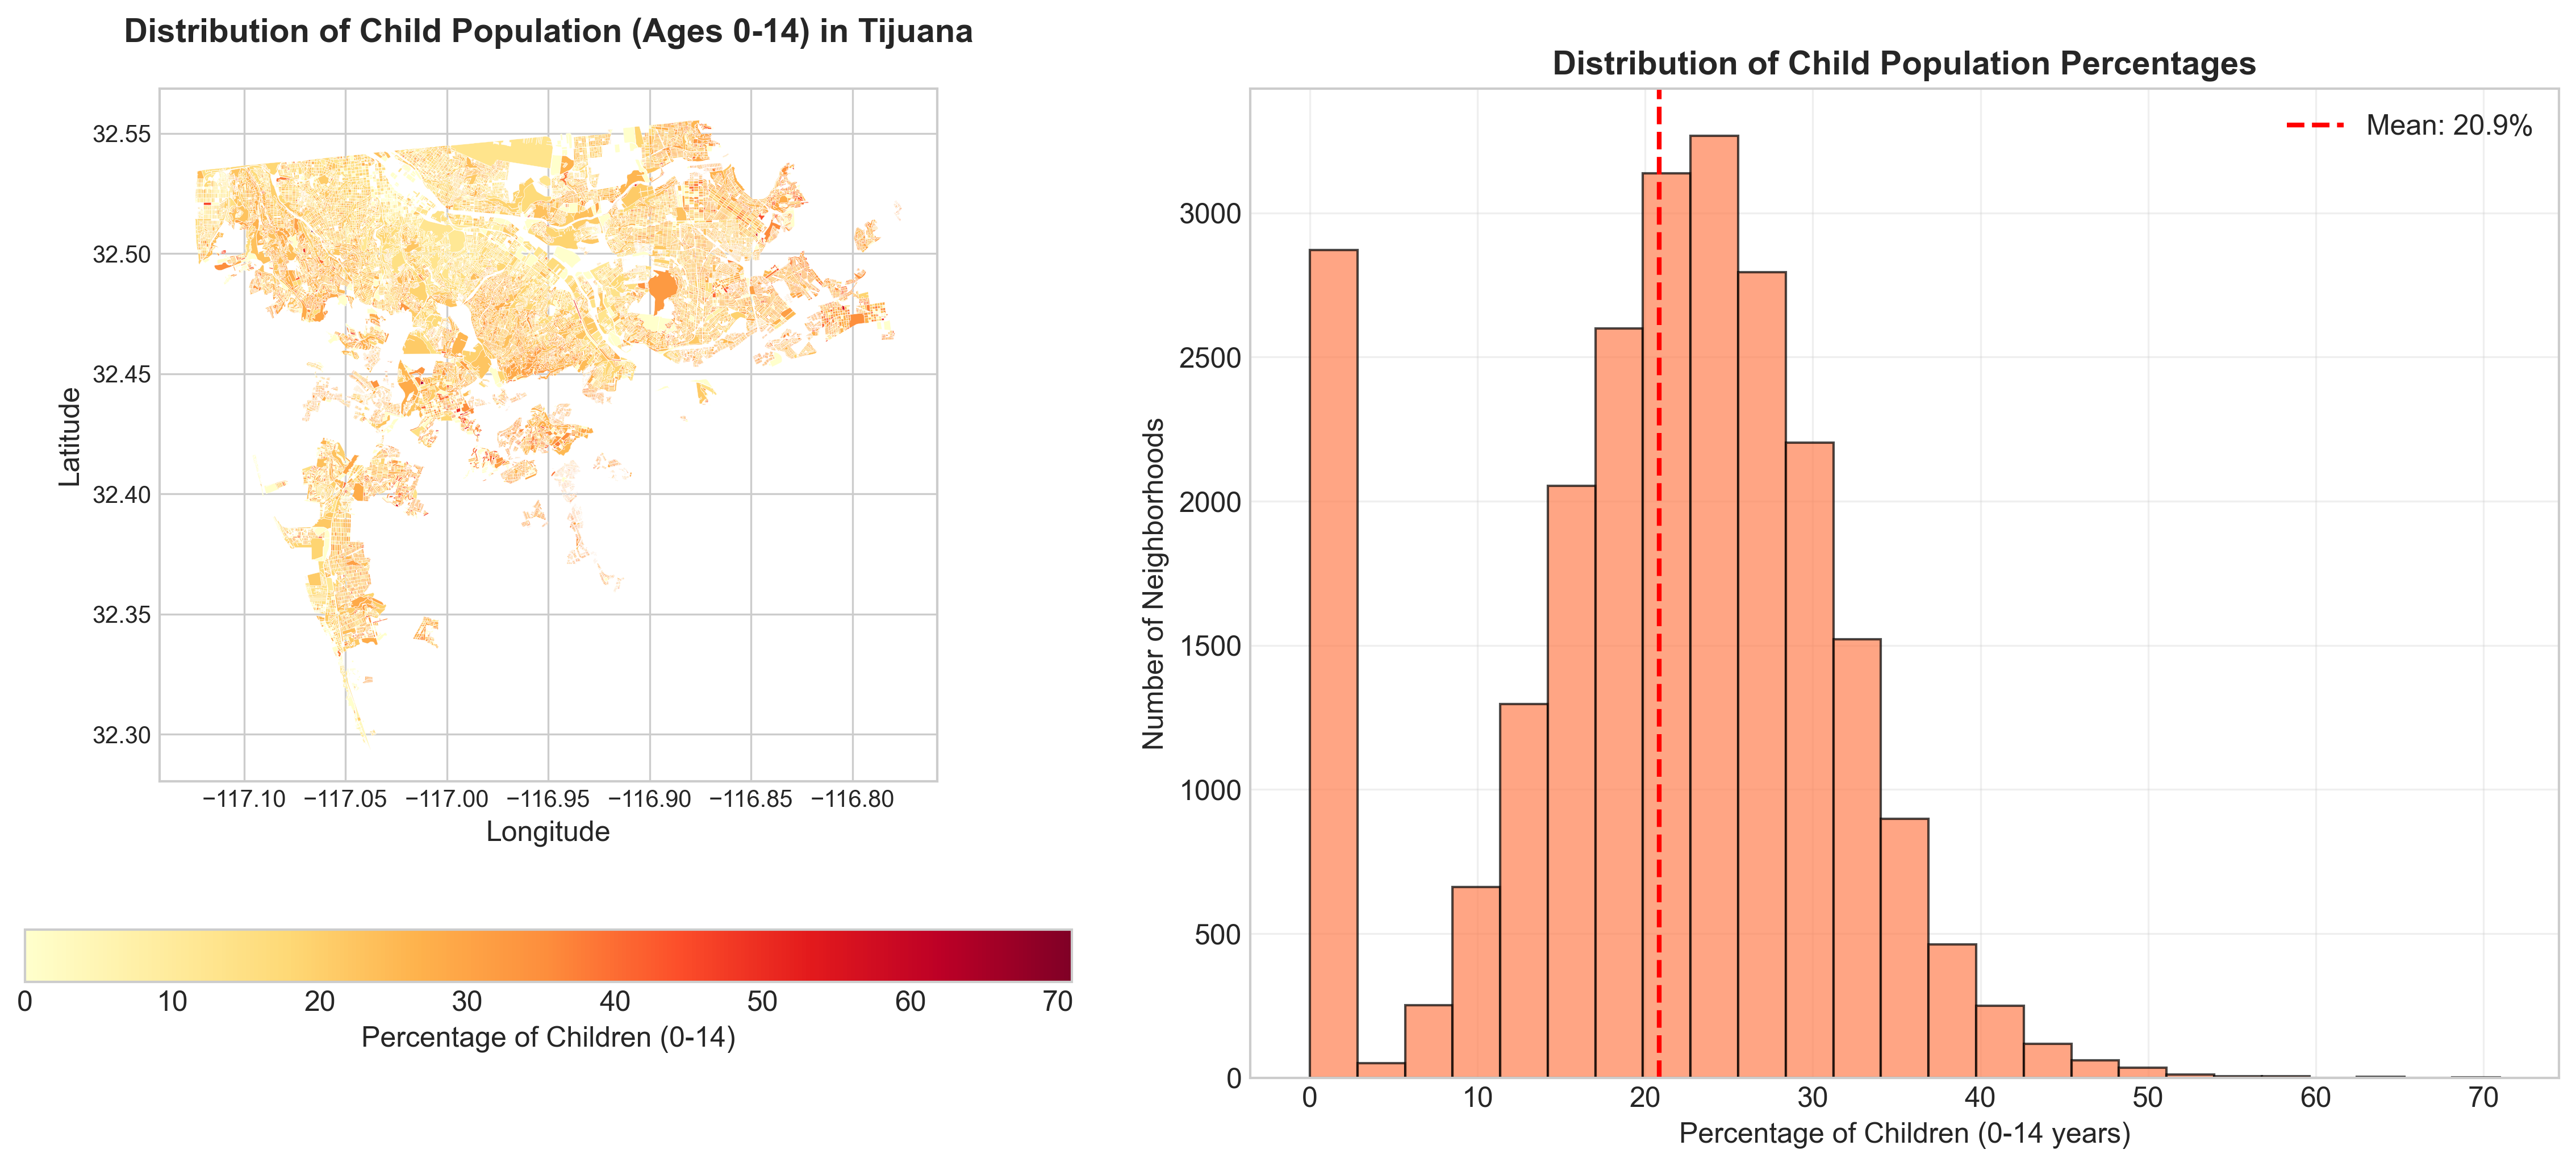 Distribution of child population (ages 0-14) across Tijuana neighborhoods showing dramatic spatial clustering
What The Pattern Suggests
The main point is that child-related vulnerability is not randomly distributed. Some parts of the city carry a much heavier concentration of disadvantage than others.
The strongest relationship in the data is between child population density and housing quality. Areas with more children tend to show weaker housing conditions. Educational vulnerability also matters, although the relationship there is weaker.
That may not sound surprising, but putting it on the map helps. It shows where these conditions overlap instead of treating them as separate city-wide averages.
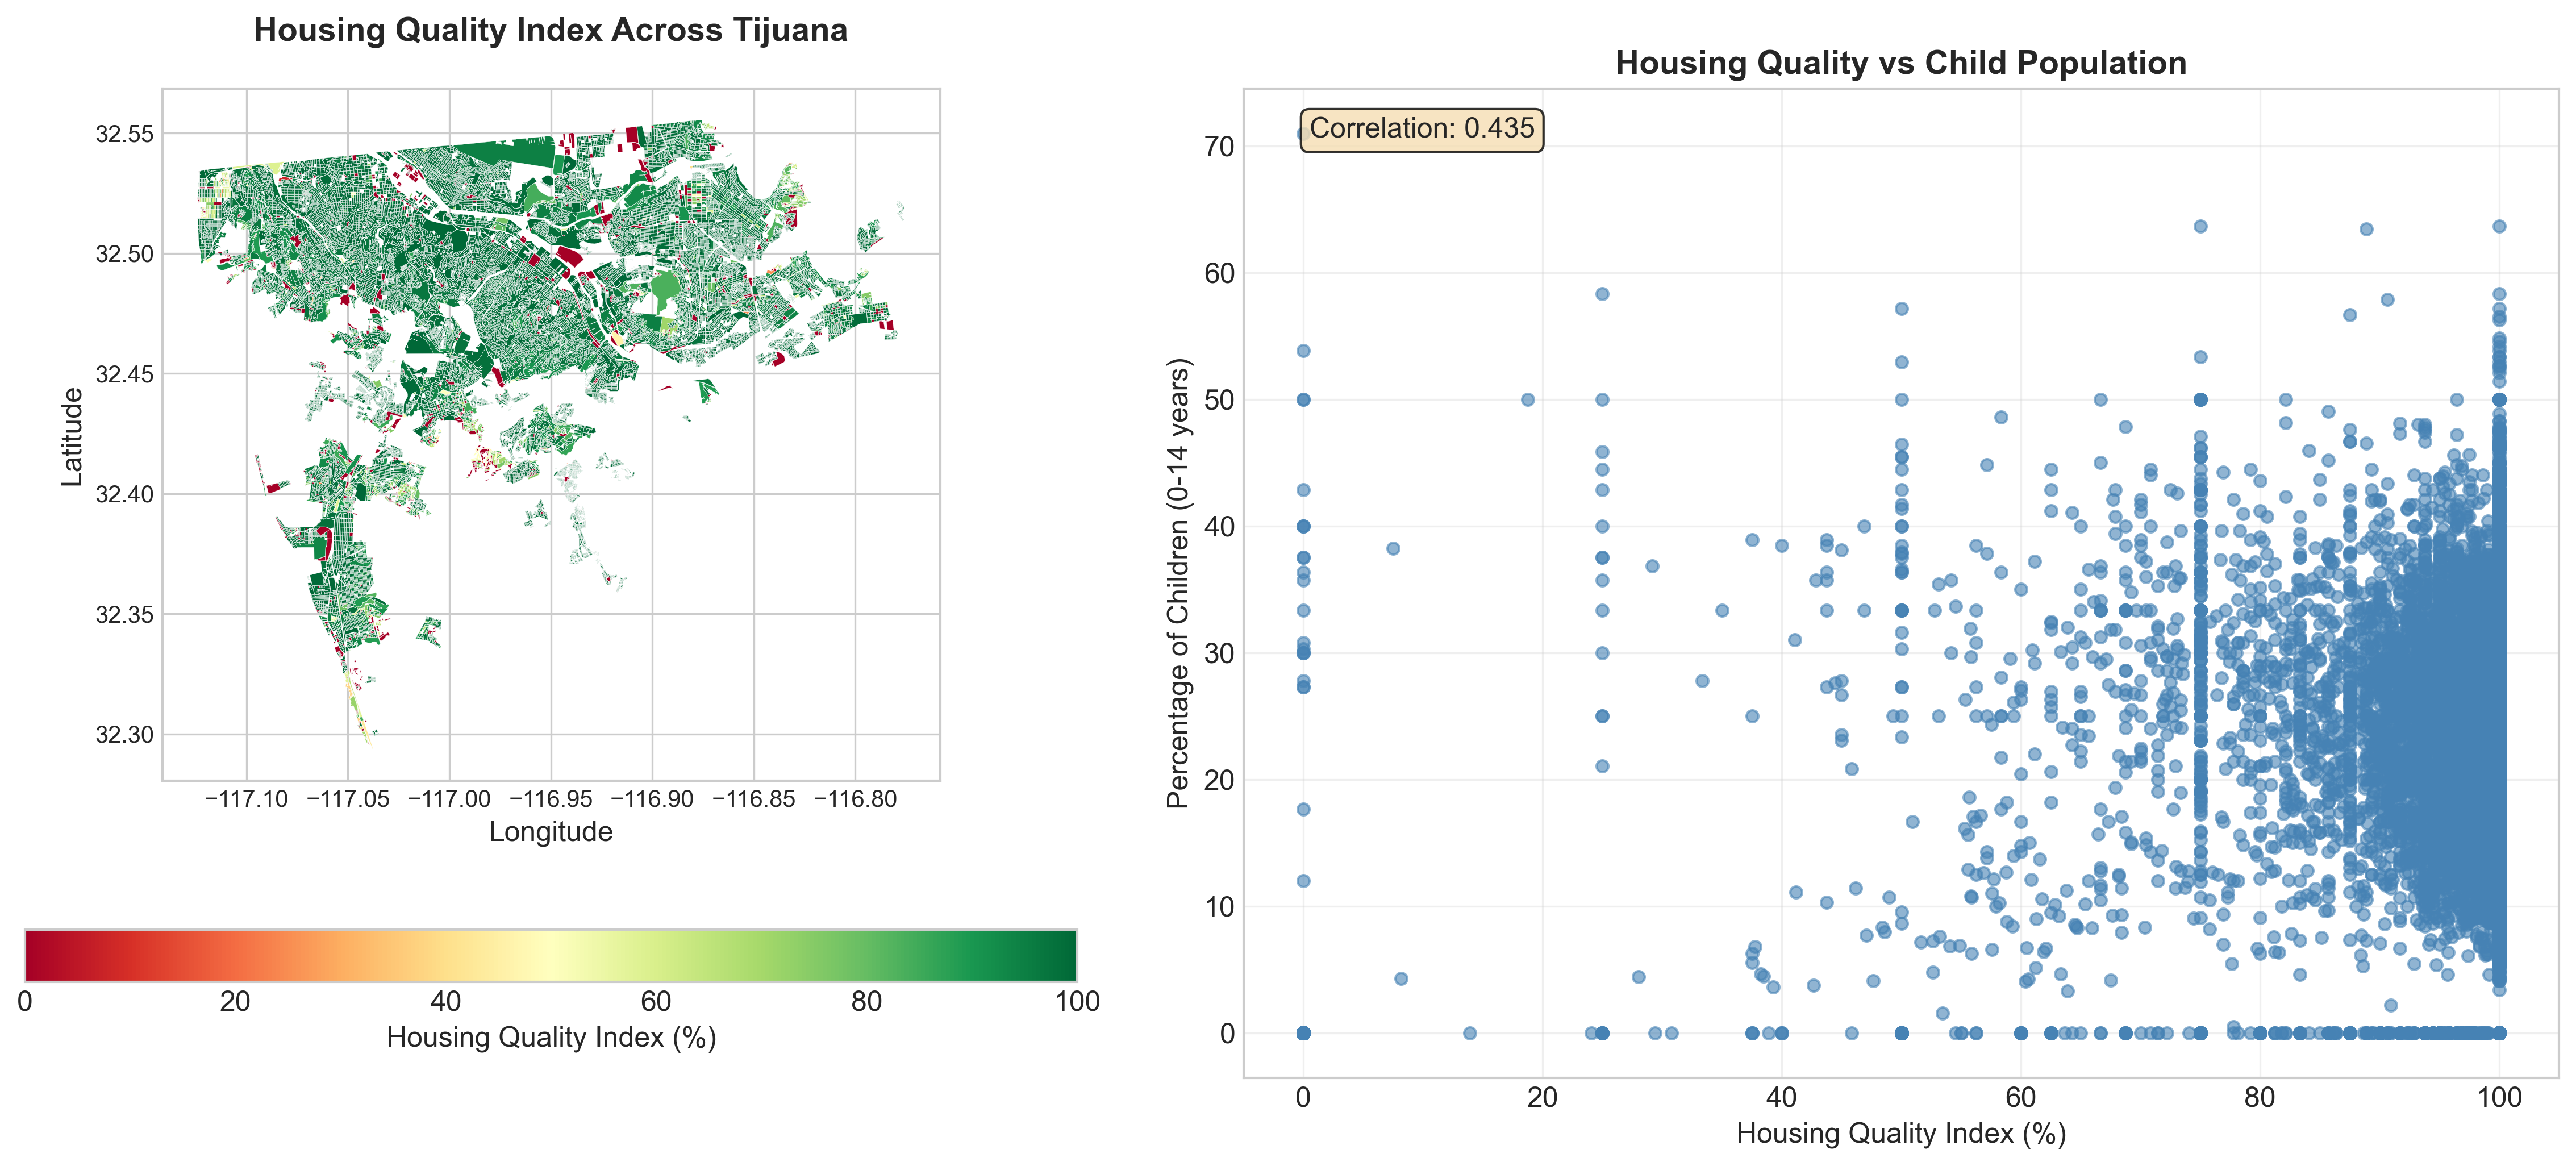 Housing quality index across Tijuana shows clear correlation with child population density
Policy Implications
If this kind of analysis is used carefully, it can support more targeted public discussion and intervention:
- Geographic Targeting: High and extreme vulnerability clusters should be prioritized for social programs, educational infrastructure, and basic service improvements.
- Integrated Approaches: The correlation between child population density, educational attainment, and housing quality suggests that effective interventions must address multiple dimensions simultaneously.
- Border City Specifics: Tijuana’s position as a border city creates unique challenges, including high migration flows and informal settlement growth that require specialized urban planning approaches.
- Long-Term Tracking: Repeating the same type of analysis over time could show whether vulnerability is staying fixed, spreading, or shifting geographically.
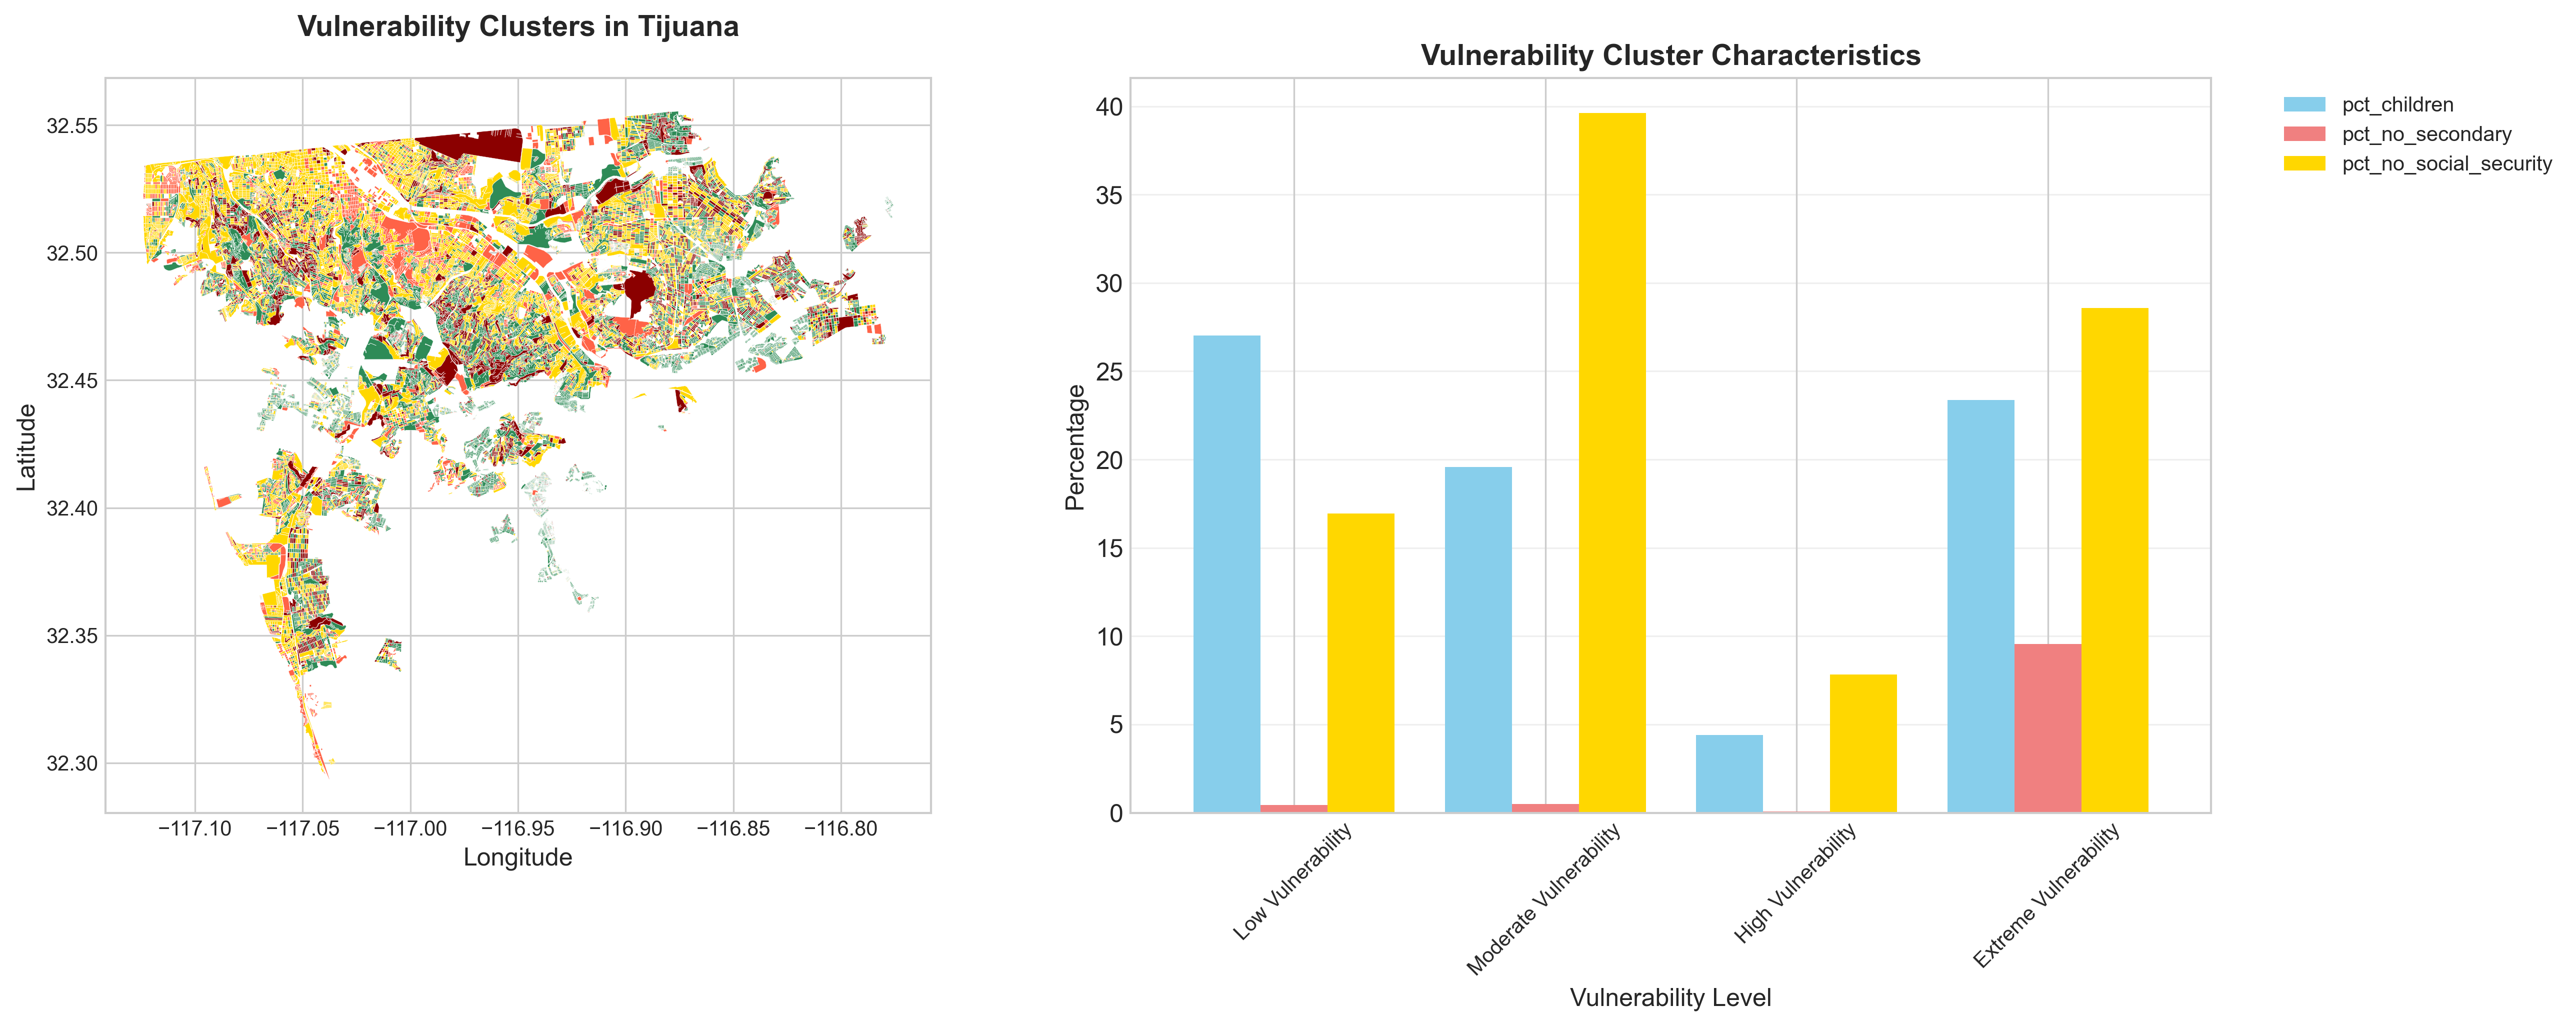 Four distinct vulnerability clusters
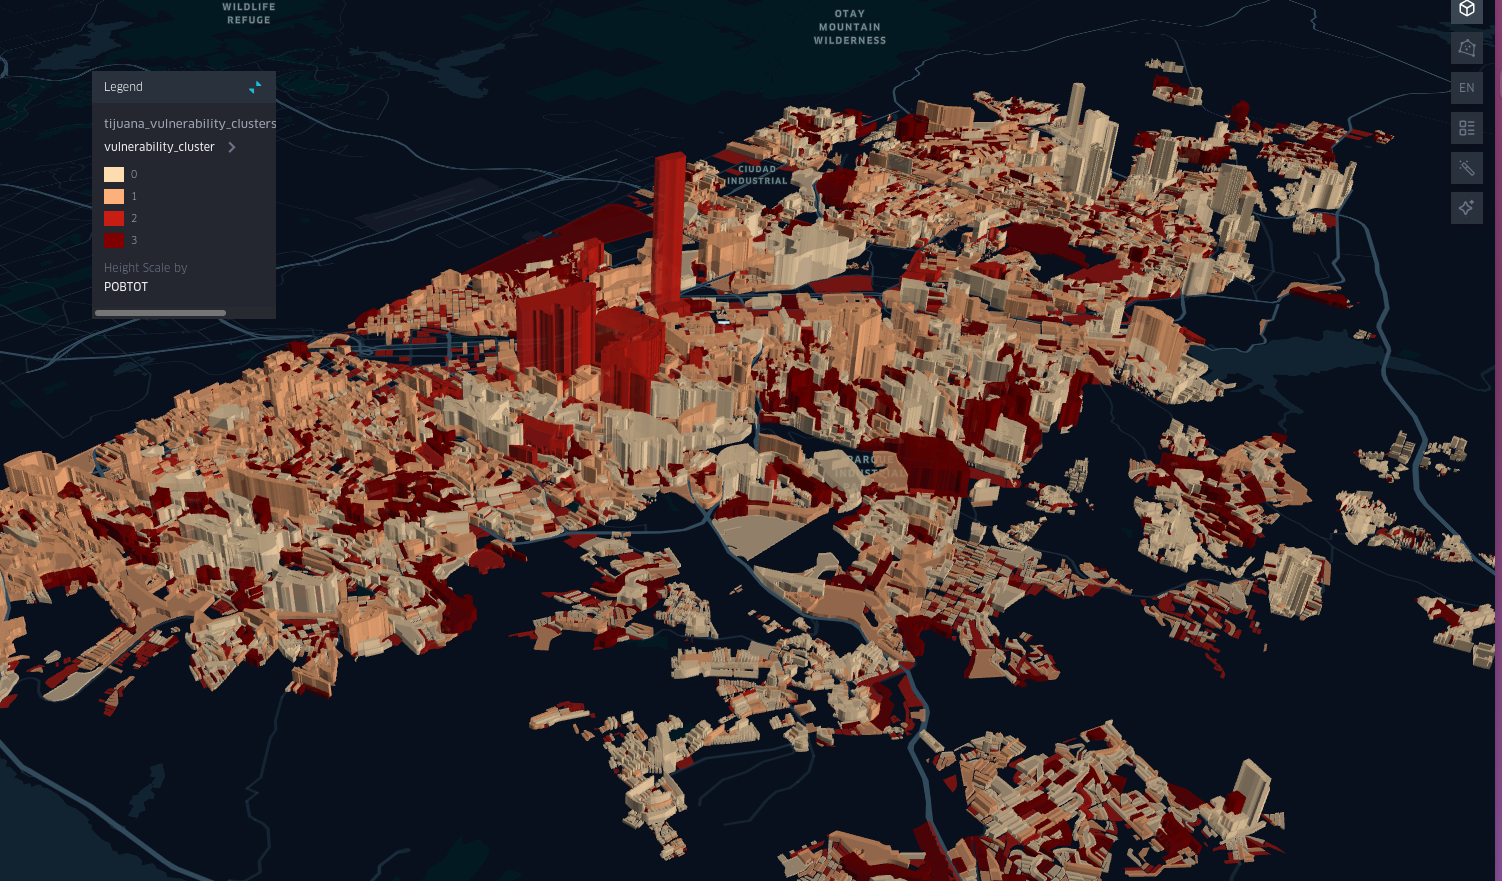 3D visualization of vulnerability patterns across Tijuana showing the spatial concentration of different risk levels with population density
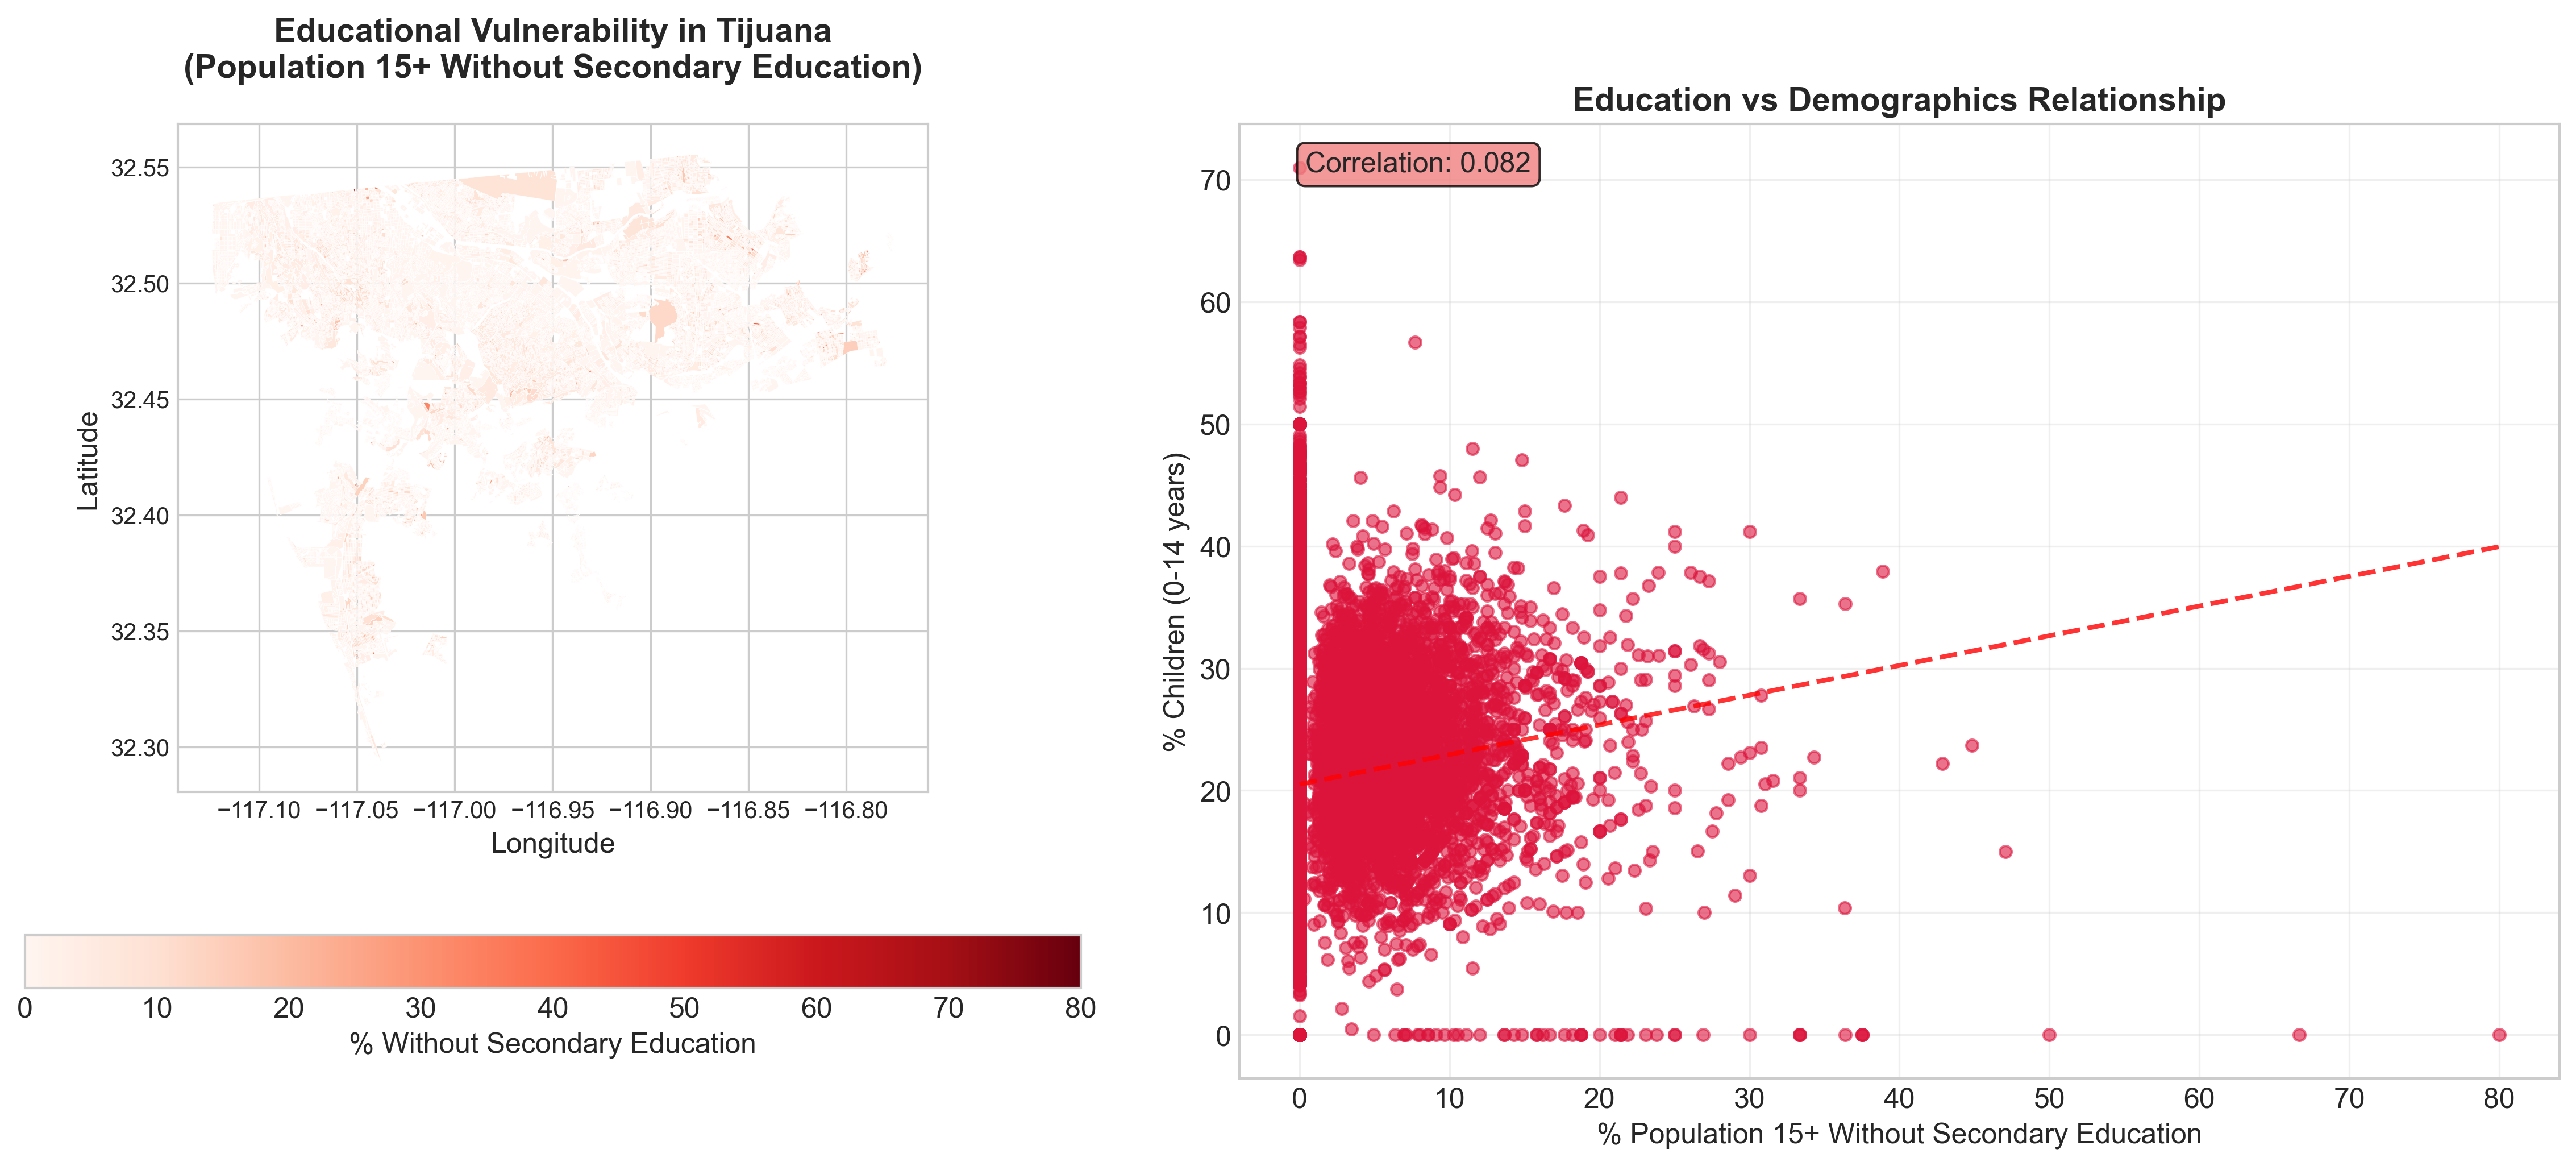 Educational vulnerability patterns show concentration of low educational attainment in specific areas
Method
The workflow was straightforward and built in Python:
- GeoPandas (v0.14.0) for spatial data manipulation and geometric operations
- Pandas (v2.0.2) for data structure handling and statistical operations
- Scikit-learn (v1.5.2) for machine learning clustering and standardization
- Matplotlib/Seaborn for statistical visualization and cartographic outputs
- Data Ingestion: Loaded 133MB GeoJSON containing 26,344 census areas (AGEBs)
- Data Cleaning: Filtered to 24,561 populated areas with comprehensive error handling
- Feature Engineering: Created composite indicators through spatial aggregation
- Machine Learning: K-means clustering (k=4, random_state=42) with StandardScaler normalization
- Statistical Analysis: Pearson correlations and spatial pattern quantification
The key indicators were:
- Child Population Density:
(POB0_14 / POBTOT) * 100 - Housing Quality Index: Composite from VPH_* variables (electricity, water, drainage, flooring)
- Educational Vulnerability: Population 15+ without secondary education completion
- Economic Vulnerability: Population without social security coverage
There are also obvious limits:
- Census snapshot limitations (temporal lag)
- AGEB-level aggregation may mask intra-neighborhood variation
- Potential under-representation of informal settlements
- Modifiable Areal Unit Problem considerations
So I would read the results as a structured approximation, not as a complete description of poverty in the city.
Conclusion
This analysis reinforces something that is easy to say and harder to show: inequality in cities has a geography.
In Tijuana, child-related vulnerability appears in clear spatial concentrations rather than as a smooth city-wide condition. That does not solve the policy question, but it gives a better starting point for asking where support is most needed and what kinds of conditions overlap there.
This analysis was conducted using Python with GeoPandas, Pandas, and Scikit-learn. Original data source: INEGI (National Institute of Statistics and Geography), Mexico.