Post
Mapping Flood Extent in Mexico With Sentinel-1
The flooding in parts of Mexico in October 2025 was a reminder of how quickly a large area can become difficult to assess from the ground. In situations like that, satellite data is useful because it gives at least a first estimate of where the water actually spread.
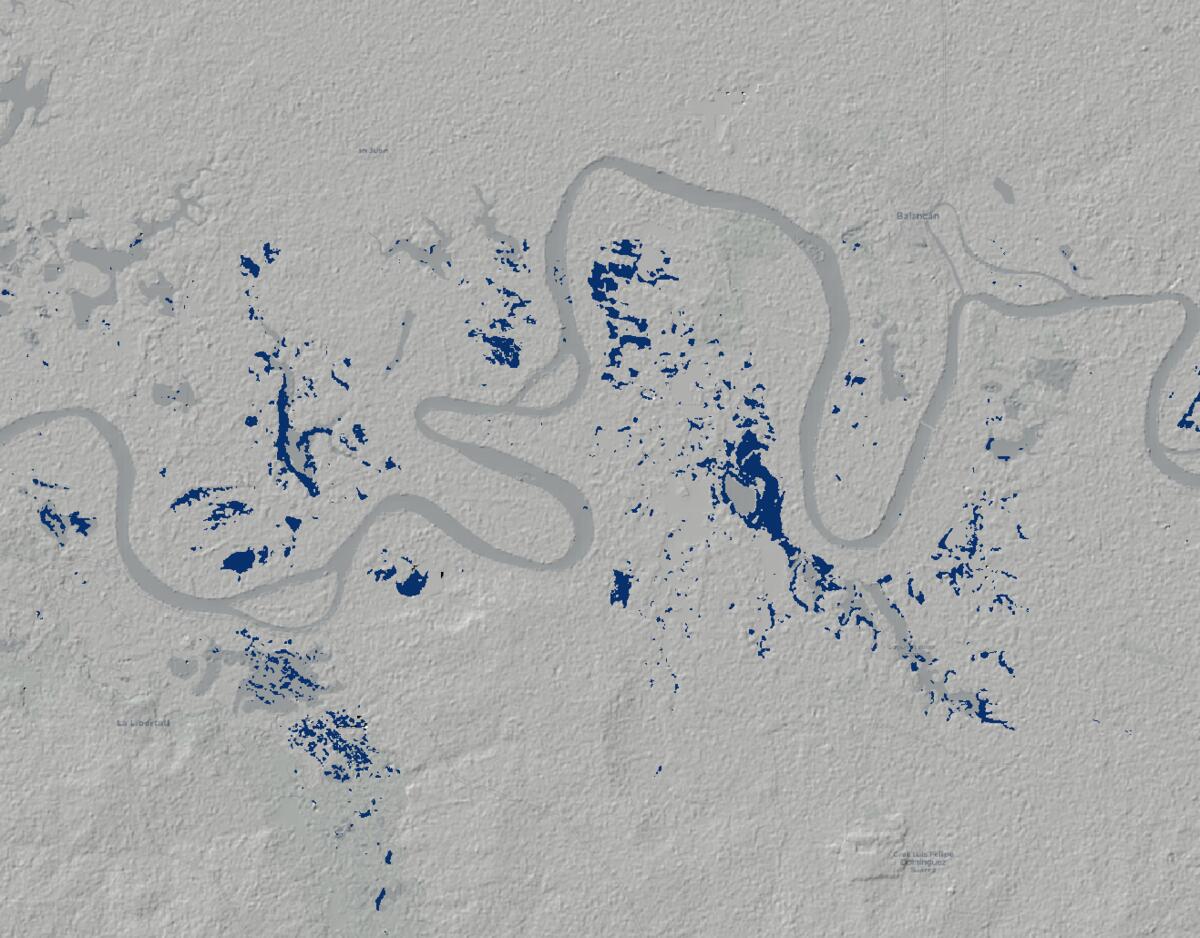 The blue areas represent the regions/zones that were flooded. This map is from the Tabasco region.
In this post I used Sentinel-1 SAR data in Google Earth Engine to estimate flood extent in a few affected areas. SAR is especially useful here because it sees through cloud cover, which is exactly what you need during heavy rain events when optical imagery is often unusable.
What I Did
The logic was simple:
- build a pre-flood baseline from Sentinel-1
- build a flood-period composite
- compare the two to detect areas where backscatter dropped enough to suggest new water
- clean the result by masking permanent water and small noisy clusters
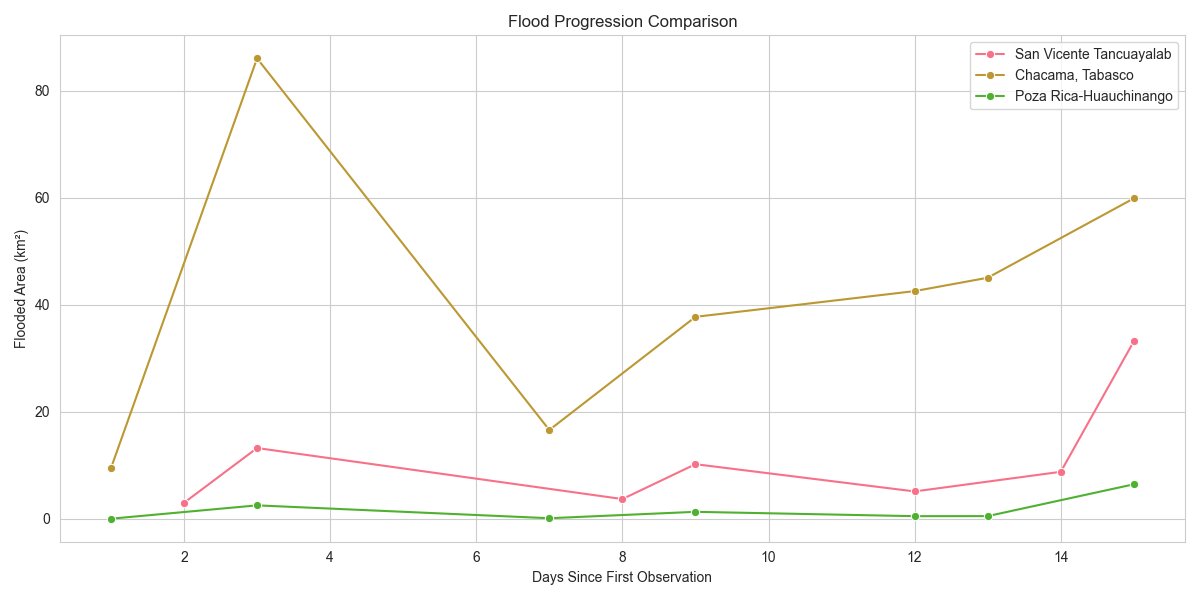 All regions have been affected by the flooding and situation got worse towards the weekend of 11th to 12th October.
That does not give a perfect flood map, but it gives a usable first approximation of the inundated area.
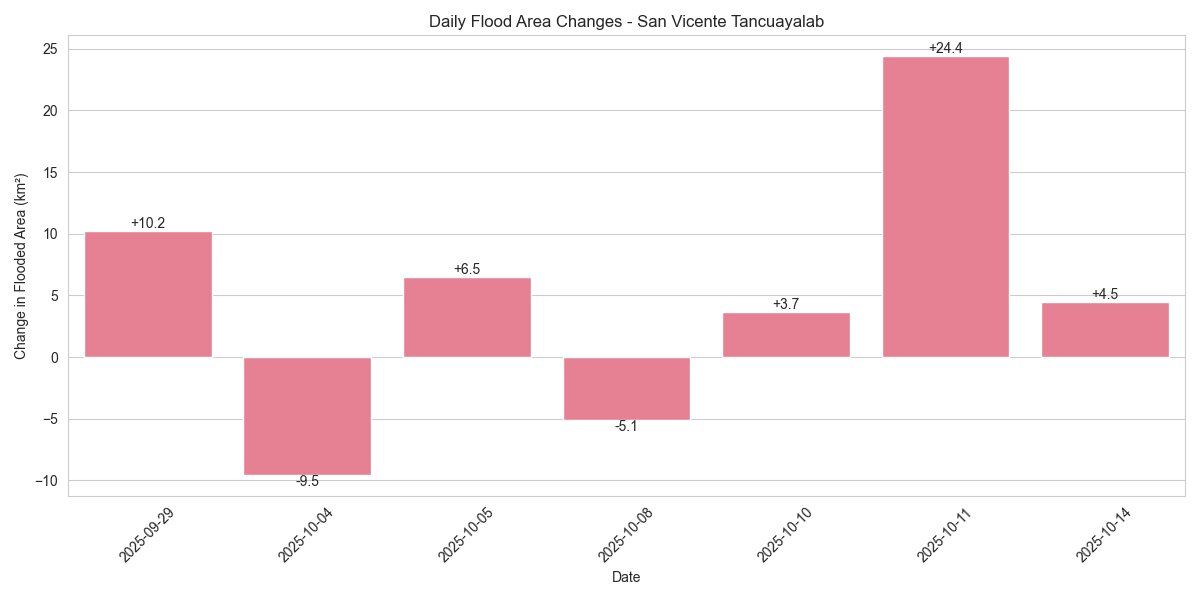 According to this analysis the flood extent changed very fast towards 11th of October in the region of San Vicente Tancuayalab (San Luis Potosi).
Method In Brief
The workflow relied on the all-weather, cloud-penetrating capability of SAR:
- Data Preparation: I filtered the Sentinel-1 archive to create two median composites: one for the baseline period in late September 2025 and one for the flood period up to 13 October 2025.
- Change Detection: I calculated the difference between the two and flagged areas where the radar signal dropped sharply enough to suggest surface water.
- Cleaning: I removed obvious noise and masked permanent water bodies using the JRC Global Surface Water dataset.
Why This Is Useful
On its own, a flood extent layer is only the first step. It becomes much more useful when you combine it with exposure data such as population, land cover, transport networks, and elevation.
That can support estimates for:
- Exposed Population (using data from e.g. JRC, European Commission: GHSL)
- Agricultural and Structural loss (using e.g. ESA Worldcover)
- Isolation Analysis (using e.g. OSM road Network or Overture data)
- Estimated Flood Depth (using e.g. SRTM, NASA or local data on Mexico from INEGI)
I would still treat the current result as exploratory. Flood mapping from SAR is powerful, but it depends on thresholds, timing, terrain, and local surface conditions. It is very useful for a first operational picture, not a final legal truth.
If you want to inspect or extend the workflow, I uploaded the Python script to GitHub:
You can find the complete, documented Python code here (in a GIST, a way to share code snippets via Github):
Disclaimer: Scope and Limitation of Analysis
The data and maps presented in this blog series are derived from the Copernicus Sentinel-1 satellite imagery and processed using the Google Earth Engine (GEE) platform. This content is published strictly for non-commercial, educational, and exploratory purposes only.