Post
Using Census and Electoral Data for More Precise Campaign Targeting
A practical look at what section-level electoral analysis can reveal for campaign work
Campaigns are always short on time, money, and attention. The geographic question is simple: where should we actually focus?
In many campaigns, the answer is still too broad. Resources get spread across municipalities, districts, or entire cities based on rough assumptions. But elections are usually decided in much smaller places than that.
That is where GIS becomes useful. If you combine census data with section-level electoral results, you can stop talking about “the city” or “the district” as if they were homogeneous and start looking at the neighborhoods where turnout, persuasion, and demographic change actually matter.
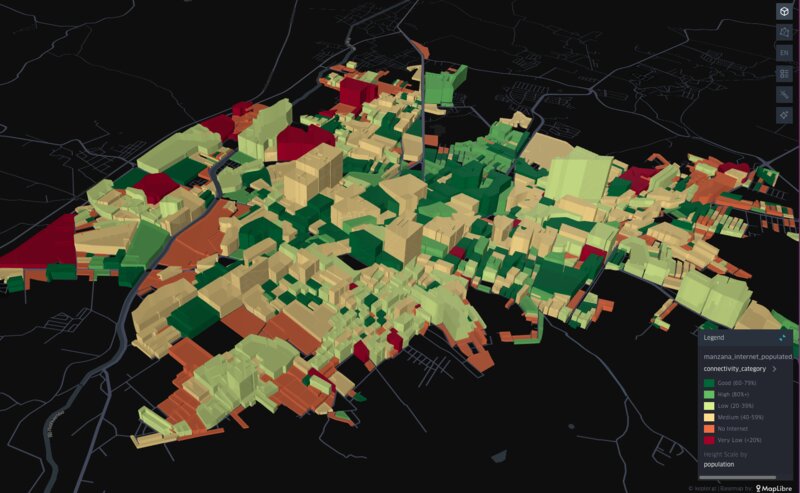 Connectivity in Uriangato (Guanajuato) from under 20 % (red) to 100 % (green), 3D reflecting population
Why Broad Geographic Targeting Fails
Most campaign targeting still relies on broad demographic shortcuts:
- suburban families
- young voters
- working-class districts
- rural conservatives
- urban progressives
Those categories are not useless, but they are too coarse to guide field work well. Inside one municipality or even one postal area, the local reality can differ a lot.
One area may have low turnout but favorable demographics. Another may be highly competitive but already saturated. A third may look attractive on paper but have weak accessibility or low communication reach.
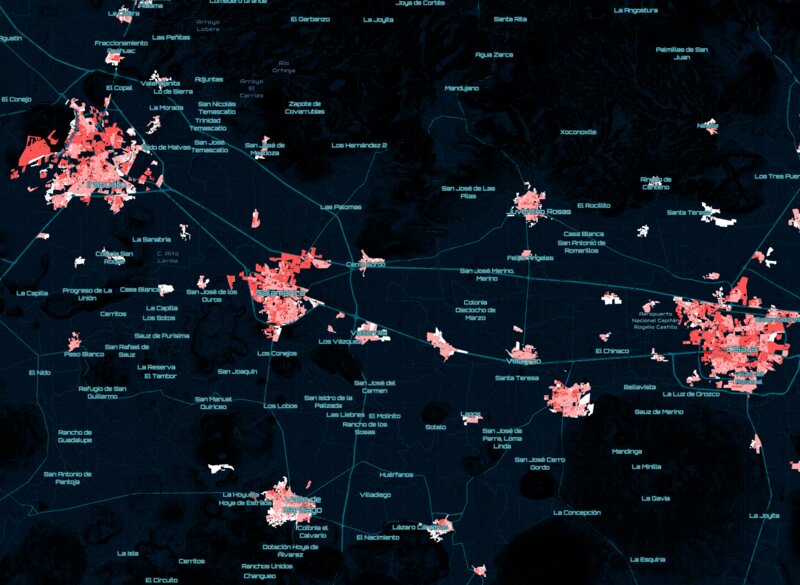 Internet accessibility changes hugely among neighborhoods in the main cities of Guanajuato
What Section-Level Analysis Adds
The useful level here is the electoral section. Once you bring census variables and electoral results to that level, a few things become visible very quickly:
- sections where turnout is low but the social profile looks favorable
- sections where the race is close enough that local effort could matter
- sections where demographic change may not yet be reflected in campaign assumptions
- sections where outreach methods should differ because connectivity and local conditions differ
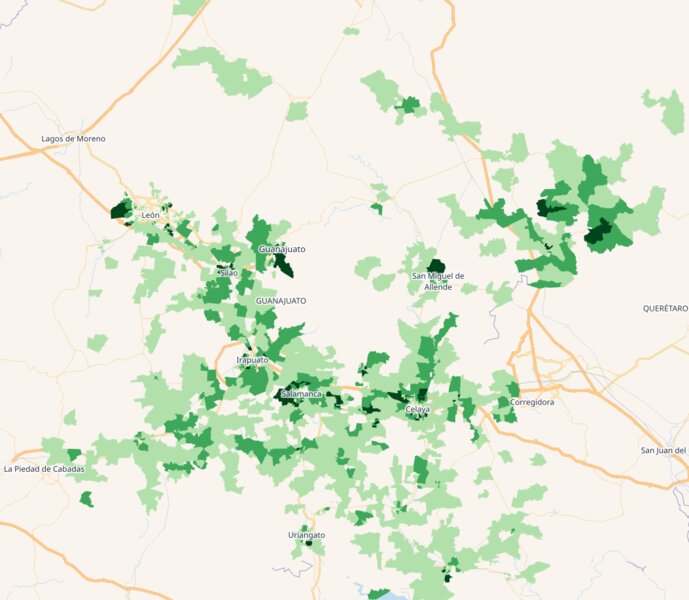 Campaign Return of Investment (ROI) Potential by Electoral Section: Strategic resource allocation analysis combining voter volume with electoral competitiveness to identify maximum impact zones (greener the better) for campaign investment.
This is not magic and it does not replace field knowledge. But it gives campaigns a much better starting point for deciding where to place local effort.
What I Would Look For
If I were doing this for a real campaign, I would start with three questions:
- Where are the sections that combine population weight with electoral competitiveness?
- Where are the sections whose demographics suggest potential but whose turnout remains weak?
- Where does the local communication strategy need to change because the area is not well served by the same channels as elsewhere?
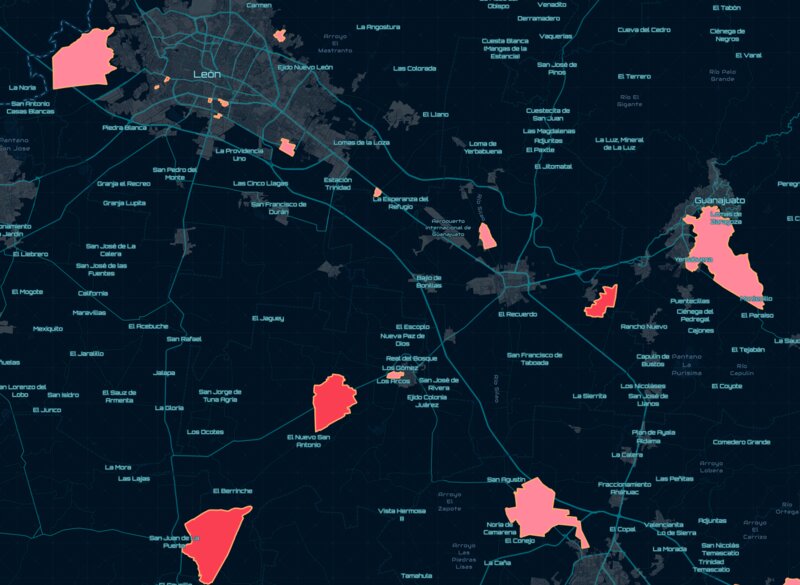 High and very high priority neighborhoods: areas with low voter turnout (2024) and high potential for electoral swing
That already gives a campaign a more grounded way to allocate volunteers, place field offices, and adapt messaging.
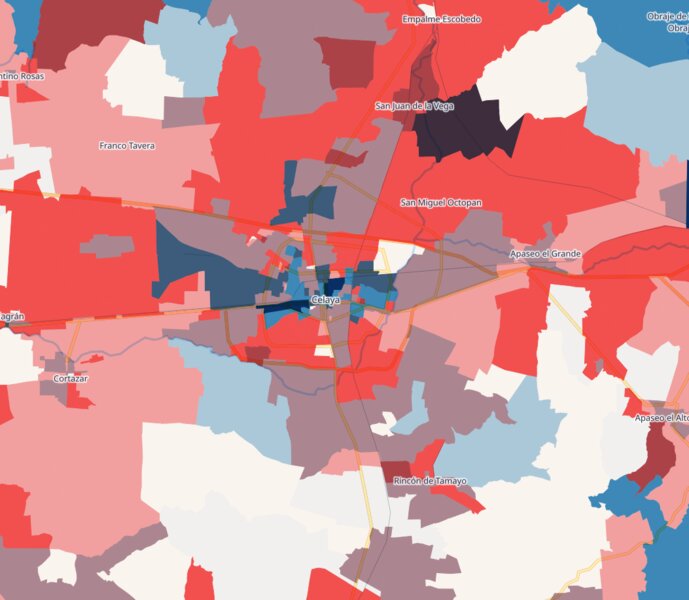 The presidential electoral results (2024) in City of Celaya, red for higher rates of support for Morena and blue for higher voter gains from the oposition.
Why This Matters In Practice
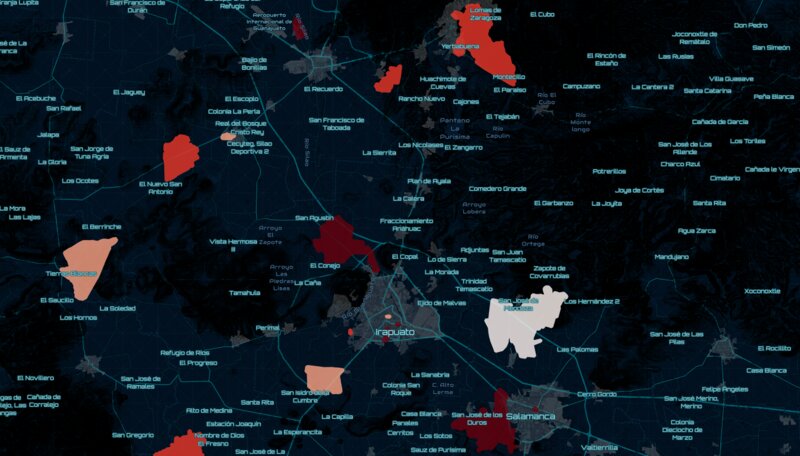 Competitiveness score among the high priority neighborhoods: darker red areas show where election results (2024) were closest to a 50-50 split between MORENA and opposition parties
The value here is not only in finding “promising” areas. It is also in avoiding waste.
Campaigns often spend too much effort in places that are already decided, already saturated, or poorly matched to the chosen outreach method. A section-level view helps narrow that down.
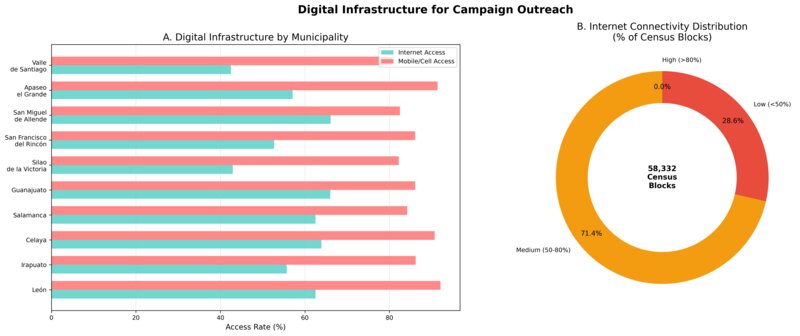 Deciding on the outreach method is highly relevant because of the different internet access and mobile phone internet access coverages across the municipalities (besides the suburban zones)
This becomes even more relevant in places where internet access, mobility, or settlement patterns vary a lot within the same municipality. The same campaign tactic does not fit every area equally well.
Final Thought
I see this less as a political trick and more as a basic analytical discipline. If campaigns already work geographically, they should at least do it with better spatial evidence.
The main point is simple: elections are often discussed at scales that are too large to be operationally useful. GIS helps bring the question back down to the level where campaigns actually act.
Data Sources and Disclaimer:
This analysis utilizes official data from the Instituto Nacional de Estadística y Geografía (INEGI) Censo de Población y Vivienda 2020 for demographic indicators, and electoral results from the Instituto Nacional Electoral (INE) corresponding to the 2024 presidential election. All geographic boundaries and administrative divisions are based on official INEGI cartographic products.
Disclaimer: This analysis is provided for educational and informational purposes only. The findings and interpretations are analytical exercises based on publicly available data and do not constitute political advice or endorsements.