Post
Data for urban mobility planning
Clean growth, climate action, and basic urban functionality all push cities to think about mobility in a more data-driven way.
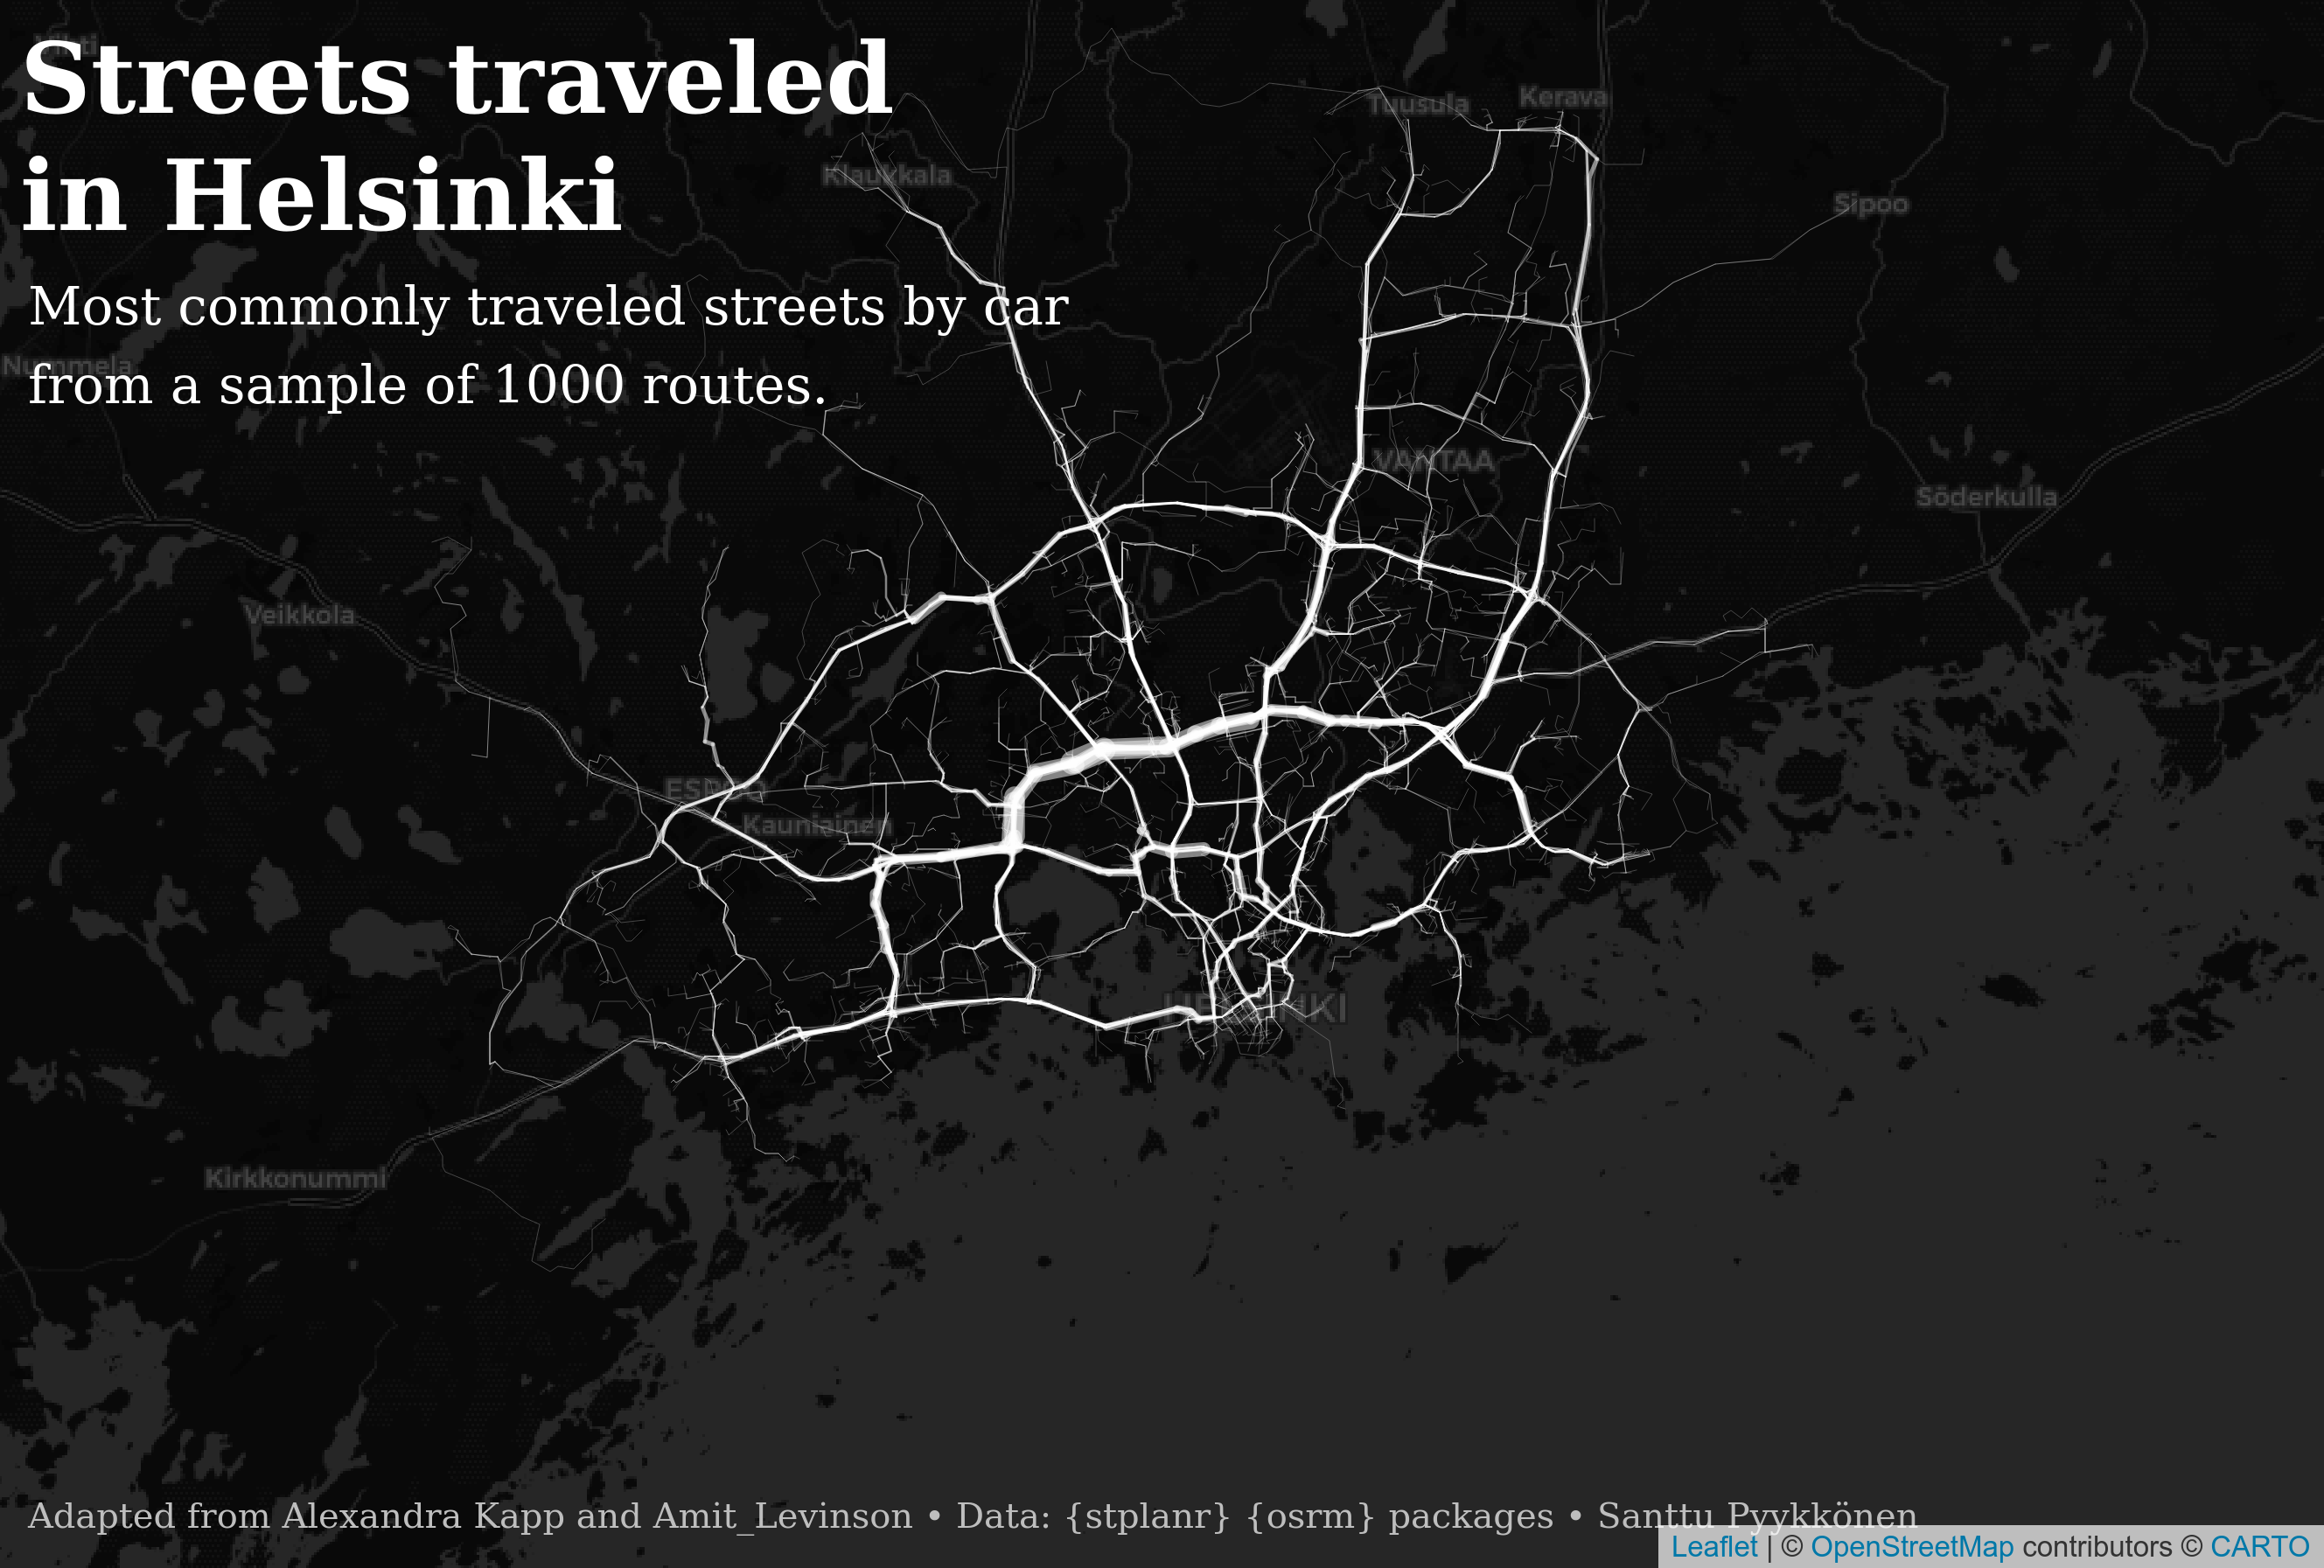
Modeling urban flows - for what?
I saw an interesting analysis from Amit Levinson during the #30DayMapChallenge, and I wanted to try something similar with cities I have lived in myself.
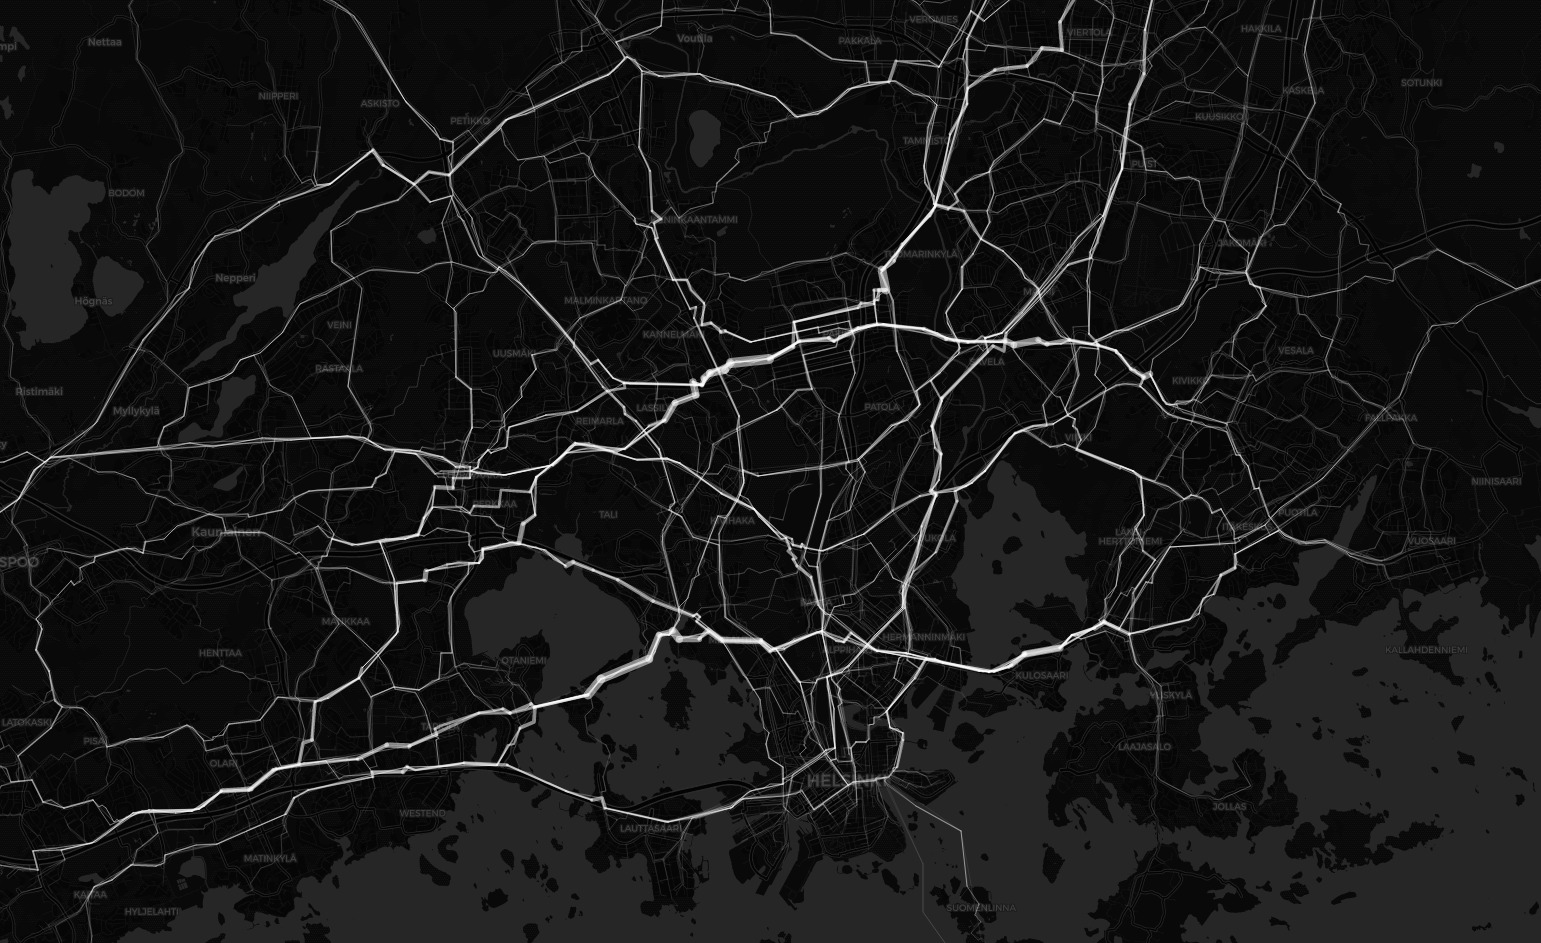
As a result, you can observe the probable cycling paths within the Helsinki metropolitan area. I calculated 1000 routes on the basis of population density and the distribution of urban destinations such as shops.
From personal living experiences to data-driven analysis
For me personally, it was interesting to analyze these cities as urban environments I’ve lived in. For example, the latter map resembles probable cycling routes throughout the city of Helsinki, whereas the first displays routes by car. The results definitely are interesting and they somewhat reflect my personal experiences on moving around in Helsinki.
The original analysis was built on randomness: locate 1000 origins and destinations within the city and calculate the routes a car driver or cyclist would probably take based on speed limits, cycling infrastructure, and similar factors. That already shows something about urban structure. Still, I wanted to reduce the randomness a bit by adding weights from population and urban amenities such as shops and schools.
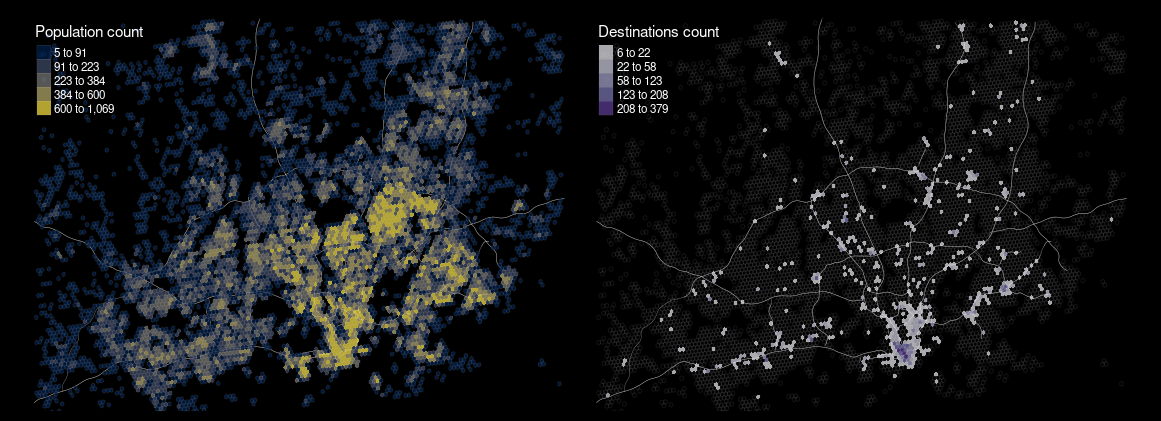 Helsinki - population count versus destinations count.
Above, you can see how the population is distributed into different places within the city as well as what are the “hot spots” of shops and amenities. So, as I wanted to include the urban departure and destination sites in the analysis and reduce the randomness, I added to the analysis the clusters of population and possible urban destinations, such as amenities (e.g. schools) and shops (e.g. supermarkets).
I think this analytical framework gives a quick overview of where the demand for cycling infrastructure may be stronger and what kinds of routes people are more likely to take.
León and Querétaro under inspection - some preliminary insights
The majority of the time I lived in Mexico, it was in León and Querétaro, which are mid-sized cities (1-1.5 million residents) in Center Mexico. If I compare the three cities of interest as a citizen as well as an analyst, it seems to be that in Helsinki there is an established cycling infrastructure which in theory could cover the city quite well, whereas in Mexico there are large neighborhoods where you need to use cycling routes that are somewhat improvised within the city.
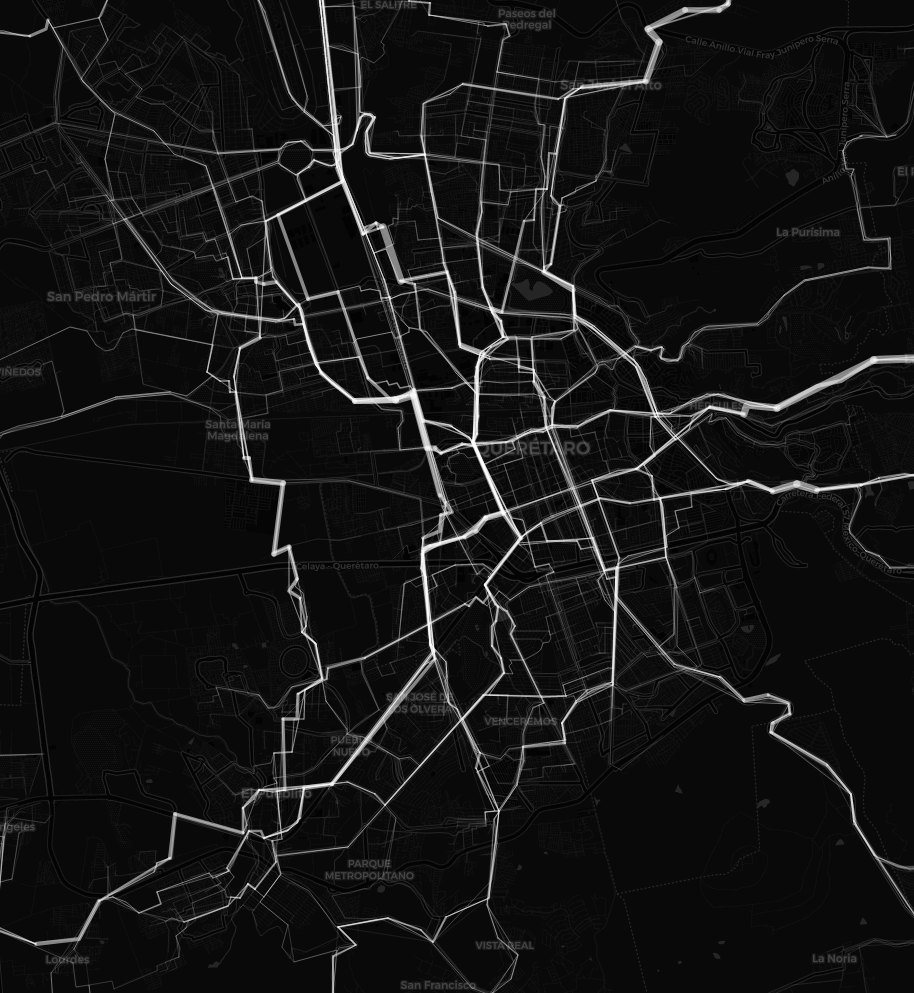 Querétaro, Mexico, by bike.
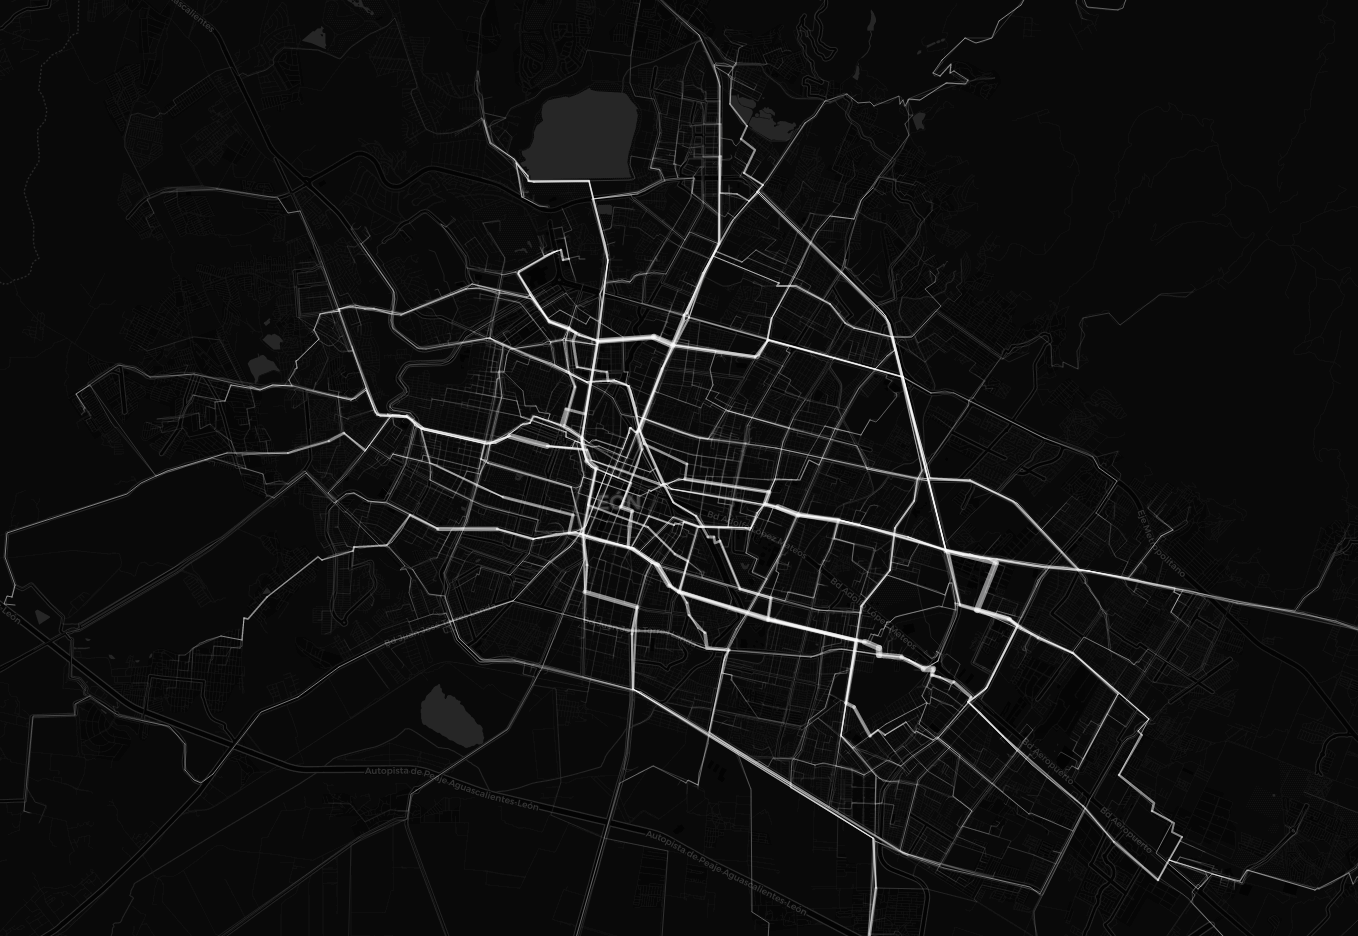 León, Mexico, by bike.
It is interesting to compare the population distribution of these cities to the distribution of amenities and shops in Querétaro and León. This is where I think we lack data, but more on that later.
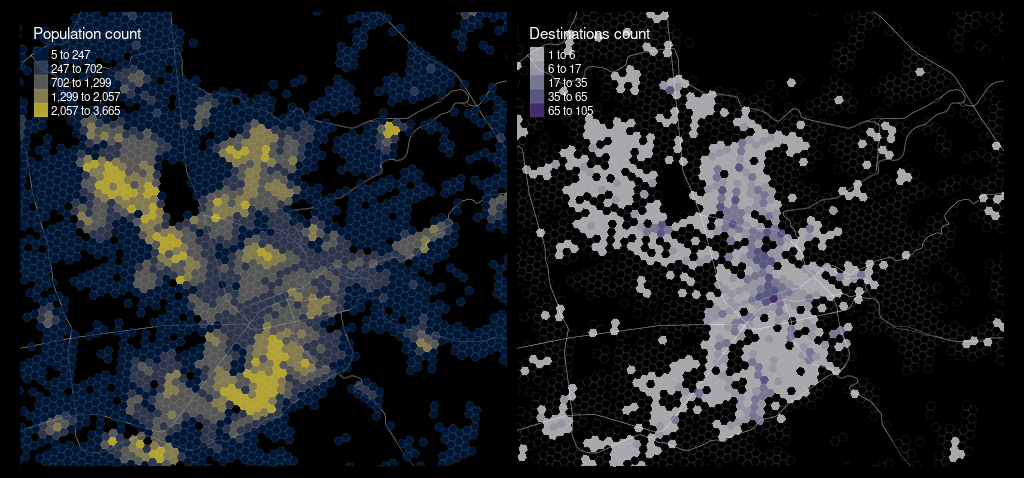 Querétaro - population count versus destinations count.
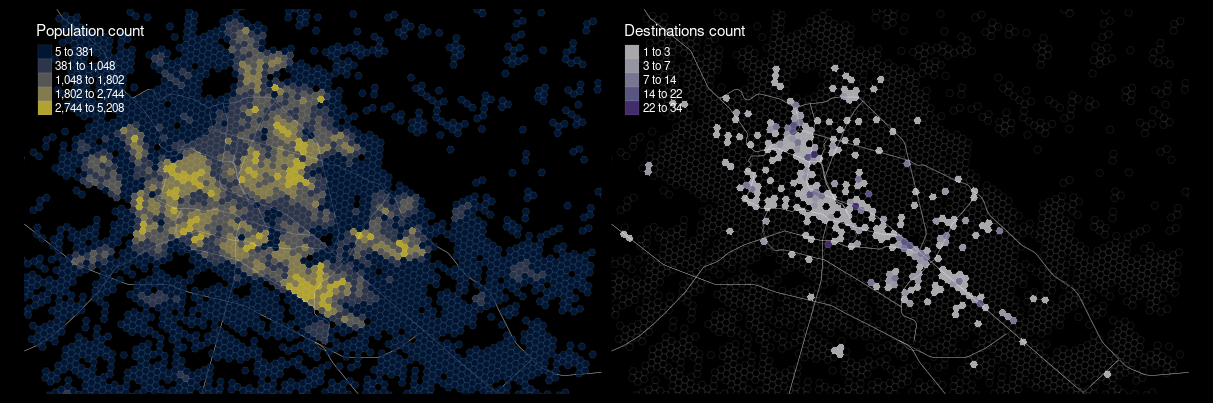 León - population count versus destinations count.
When analyzing urban flows by car, this method seems to capture quite well how car-oriented planning has structured the cities. Highways and motorways stand out very clearly in the maps below.
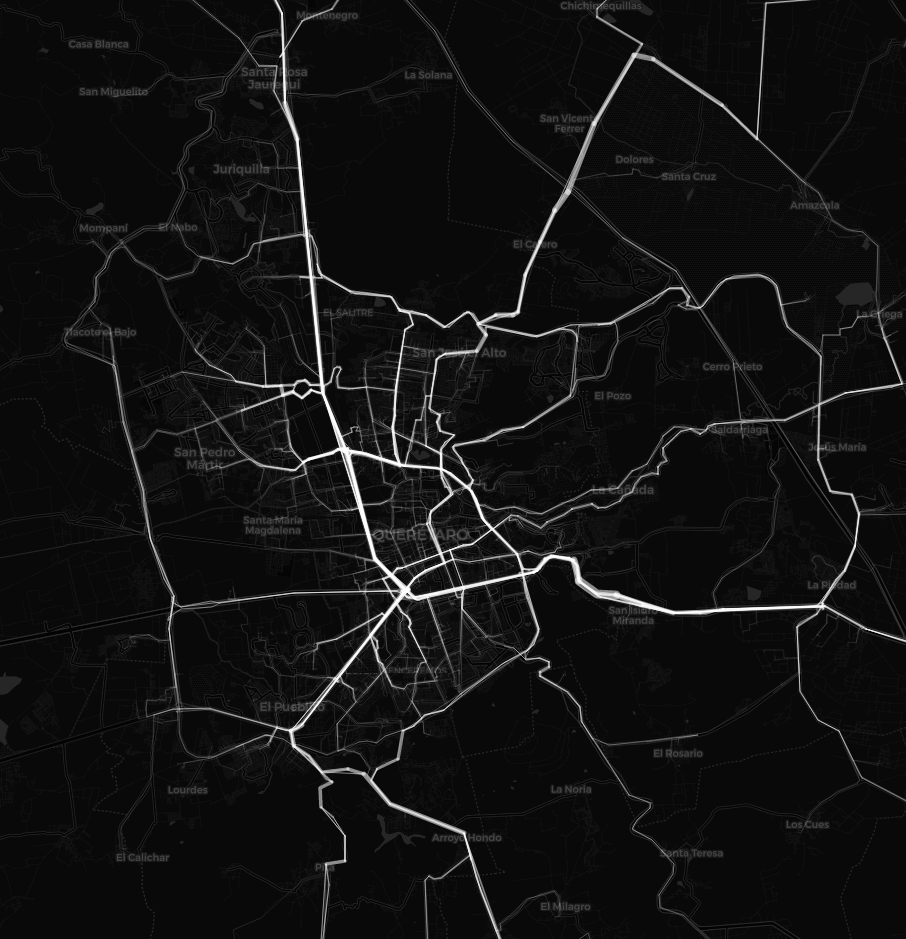 Querétaro, Mexico, by car.
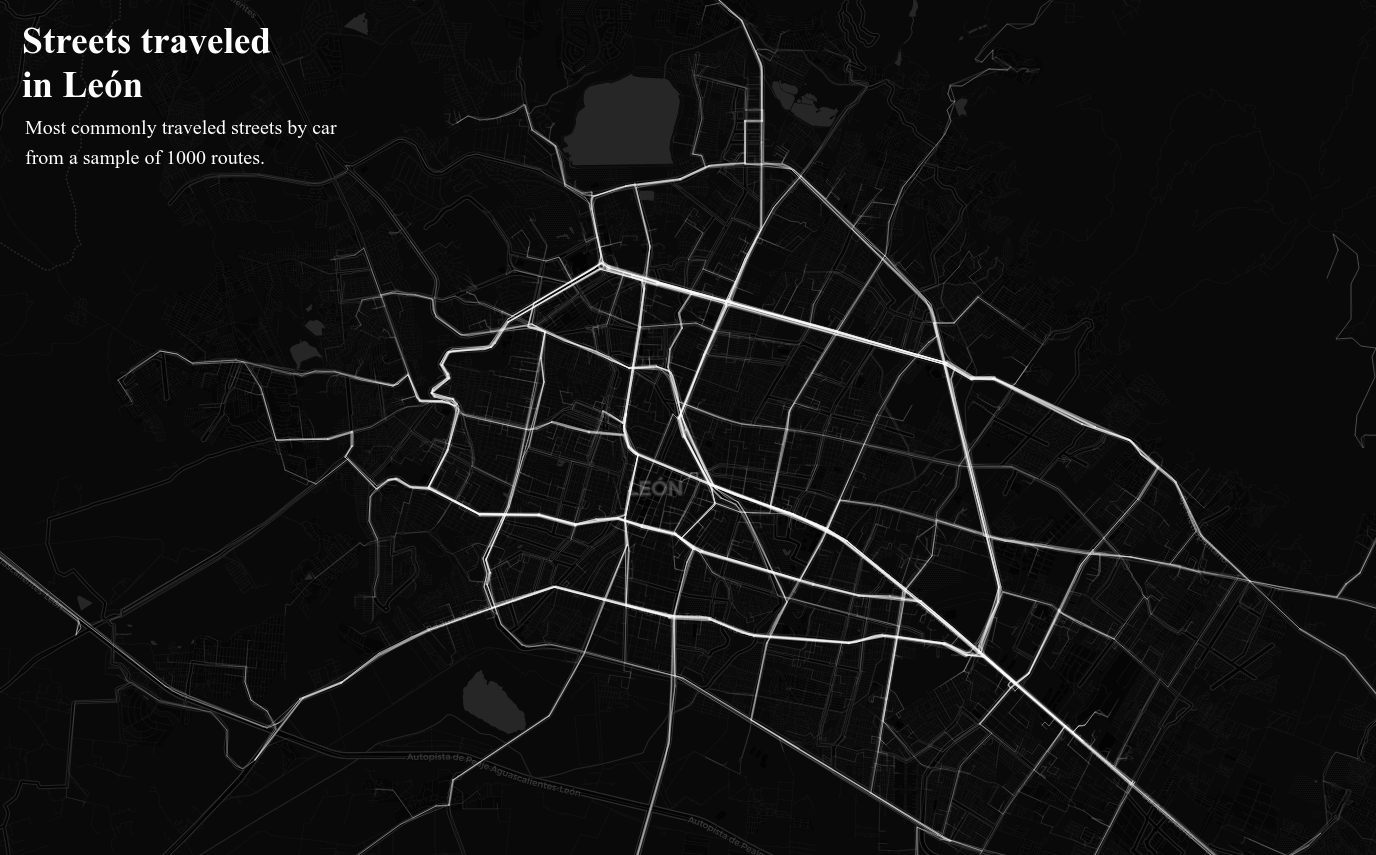 León, Mexico, by car.
Data quality as an issue in Mexico
It seems that the level of detail in OpenStreetMap in León and Querétaro is not as high as in Helsinki. If I were to continue this line of analysis, it would make sense to compare it with DENUE, a dataset on economic units from INEGI. It has a nice API, and there is also an R package called inegiR, which could be useful here.
Modeling urban flows: fresh perspectives to an old challenge
I would conclude this quick detour into urban mobility with one simple point: we now have open data and open source tools that make this kind of urban analysis much more accessible than before.
OpenStreetMap and Humanitarian data exchange are helping cities to really change the way they plan the cities all around the world. There’s a lot of data, no doubt about it.
As cities evolve, also the data evolves. An important milestone would be to move towards automated continuous monitoring instead of irregular analysis.
Open data and open source tools can help cities make transport and urban mobility safer, easier, and more efficient.
Sources:
- OpenStreetMap. Data on urban destinations (amenities and shops).
- Humanitarian data exchange. “High Resolution Population Density Maps + Demographic Estimates” from Finland and Mexico. Facebook and Center for International Earth Science Information Network - CIESIN - Columbia University. 2021. High Resolution Settlement Layer (HRSL). Source imagery for HRSL © 2021 Maxar. Accessed 17.12.2021.
- Kapp, Alexandra. Twitter. Visit Alexander’s code that initiated the whole analysis process for me. It is a quick way to analyze any kind of mobility in any part of the world. https://alexandrakapp.github.io/30daymapchallenge/index.html
- Levinson, Amit. Twitter. Visit the code Amit published on an analysis he made on Tel Aviv. https://github.com/AmitLevinson/30daymapchallenge/blob/main/2021/02_lines/lines.R
Tools:
I used R for the whole process. I have published a gist that demonstrates the code that was used for the city of León (Mexico), but can be applied one’s city of interest.