Accessibility to hospitals
Matching the populational demand and service offering in the health sector is an analytical challenge that every society and health provider face.
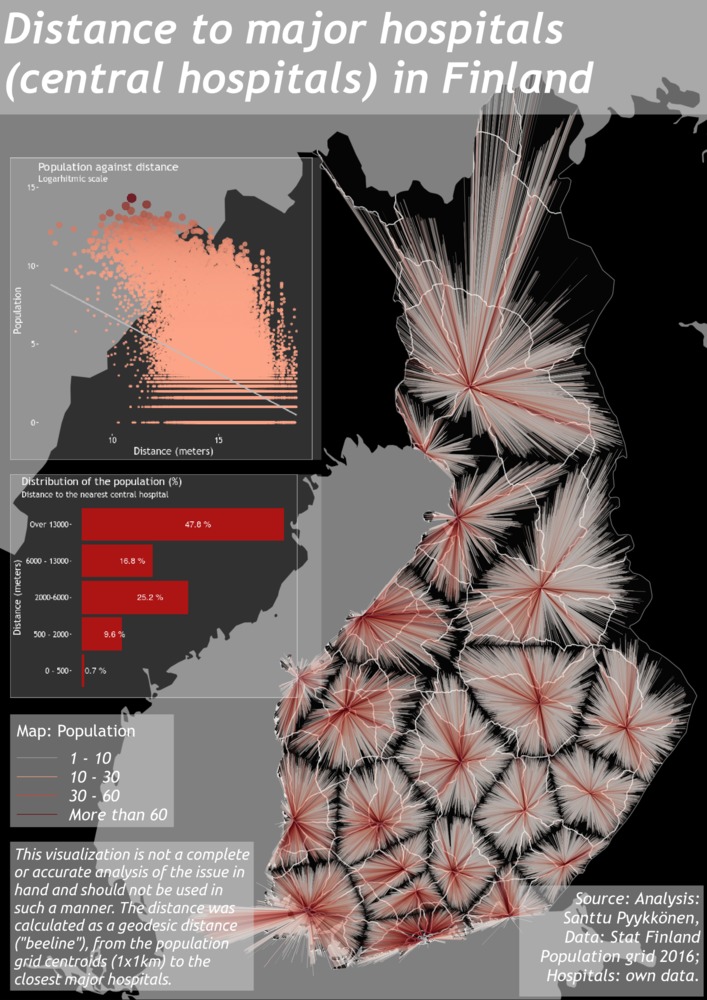
To just analyze the closeness of the Finnish population to the general hospitals with the most widest range of health services in Finland, I matched the population grid units to the hospitals, made the calculations on the populations per hospital and made a cartographic effort to display the results.
As for the tooling, I used PostGIS’s powerful lateral join function of which on geospatial/GIS use cases you cand find this great blog post by Paul Ramsey.
As to run scripts and analyze the data I used R here and when it comes to cartographic and map production I used QGIS. The lines were made with PostGIS’s ST_MakeLine function.
The data on population derives from Statistics Finland and data points on hospitals were geocoded by myself. The actual analysis included connecting every population grid unit with the closest central hospital, calculating the linear distance and summing up the results from the center point of the grid to the closest central hospital.
Tooling: PostGIS
The lines and the distances from every population grid to the nearest hospital was created with the following code:
drop table if exists pop_to_hospitals;
create table pop_to_hospitals as
	(select id,
	st_makeline(st_centroid(p.geom), h.geom) as geom,
	st_distance(st_centroid(p.geom), h.geom) as distance
	from population_grid as p
	cross join lateral (
		select geom
		from hospitals
		order by p.geom <-> geom
		limit 1) as h);
At the very end, I added a primary key and an index to the table.
alter table pop_to_hospitals add primary key (id);
create index pop_to_hospitals_geom_idx on pop_to_hospitals using gist (geom);