School accessibility in Finland
School accessibility is a theme of great importance and requires advanced geospatial analysis for solving it as a complex societal challenge.
Here I used PostGIS’s powerful lateral join function of which on geospatial/GIS use cases you cand find this great blog post by Paul Ramsey.
As to run scripts and analyze the data I used R here and when it comes to cartographic and map production I used QGIS.
When it comes to the geospatial analysis, the interesting part was processed with PostGIS: as said, I used lateral joins to connect the schools to the population grid. With the following SQL PostGIS calculated the “beeline” distance (straight line) from the centroids of the population grid to the closest schools. My goal was to have a table with data on every unit of the population grid with the data on the distances from each unit to the nearest school.
drop table if exists pop_to_schools;
create table pop_to_schools as
	(select id, pop,
	st_distance(st_centroid(p.geom), s.geom) as distance,
	p.geom
	from population_grid as p
	cross join lateral (
		select id, geom
		from schools
		order by p.geom <-> geom
		limit 1) as s);
Remember the primary keys and the indexes.
alter table pop_to_schools
	add primary key (id);
create index pop_to_schools_idx_geom on
	pop_to_schools using gist (geom);
At the end, I did the data wrangling part in R for aggregating the population to groups representing different distance-categories, but you could also run the analysis easily using plane SQL, as follows:
select
	case
		when distance <= '500' then '0-500'
		when distance > '500' and distance < '1000' then '500-1000'
		when distance > '1000' and distance < '2000' then '1000-2000'
		when distance > '2000' and distance < '3500' then '2000-3500'
		when distance > '3500' then 'Over 3500'
	end as population_sum,
	sum(pop)
	from pop_to_schools
	group by population_sum;
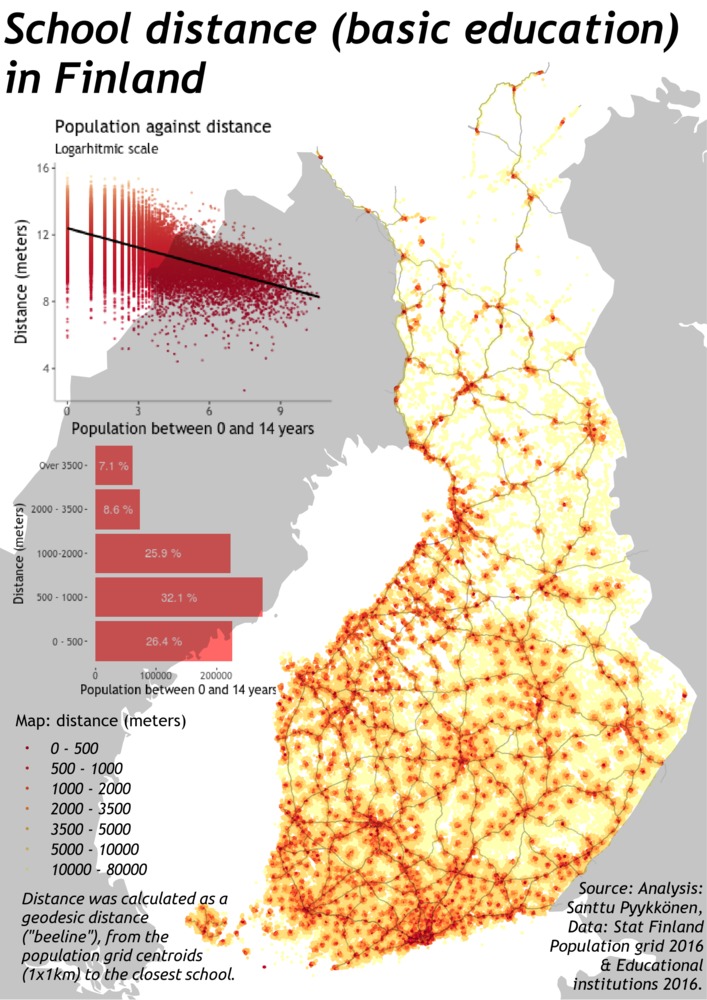
Data behind the map
The data derives from Statistics Finland. The actual analysis included connecting every population grid unit with the closest educationl institution, calculating the linear distance and summing up the results from the center point of the grid to the closest school.